Download presentation
Presentation is loading. Please wait.

1
TECHNICAL MEETING ON RESERVE DETERMINATION TOTAL OUTFLOW STRATEGY:WWT Venue: NATIONAL TREASURY Date: 24 JUNE 2014 Time: 10:00 – 16:30

2
PRESENTATION CONTENT Water Resource Protection Reserves completed and being conducted in the Mvoti to Umzimkulu WMA Monitoring action plan Next steps

3
Resource Protection Water Use Water Law Principles Efficient Equity Sustainability IWRM Economic Welfare growth Poverty eradication Social up-liftment Resource health Goods and services WATER RESOURCE PROTECTION

4
THE PURPOSE OF RESOURCE DIRECTED MEASURES (RDM) Ensure long term use of the water resources for current & future generations Quality and quantity Informs water use authorisation (e.g licenses) and conditions Setting the management objectives in terms of: Water Quality Water Quantity River, estuaries and wetland habitat and biota (living organisms)
 Ensure long term use of the water resources for current & future generations Quality and quantity Informs water use authorisation (e.g licenses) and conditions Setting the management objectives in terms of: Water Quality Water Quantity River, estuaries and wetland habitat and biota (living organisms)")
5
For different uses of water (domestic, industrial, agricultural etc.) To maintain good human health & the health of those living organisms (plants, animals, microbes etc.) existing in the water. For meeting basic human needs (drinking, bathing, cooking etc.) Maintain the natural functioning of ecosystems to produce its goods and services and prevent human and resource loss (i.e prevent flooding, pollution, eradicate poverty, water education, planning, monitoring etc) The focus is to set achievable protection measures by Classifying and determining the Reserve and Resource Quality Objectives (RQOs) –” To Develop for the environment to maintain the ecological infrastructure” PROTECTION OF WATER RESOURCES
 Maintain the natural functioning of ecosystems to produce its goods and services and prevent human and resource loss (i.e prevent flooding, pollution, eradicate poverty, water education, planning, monitoring etc) The focus is to set achievable protection measures by Classifying and determining the Reserve and Resource Quality Objectives (RQOs) – To Develop for the environment to maintain the ecological infrastructure PROTECTION OF WATER RESOURCES.")
6
RESERVE DETERMINATION StepDescription 1 Delineate the units of analysis and Resource Units, and describe the status quo of the water resource(s) (completed). 2Initiation of stakeholder process and catchment visioning (on-going). 3 Quantify the Ecological Water Requirements and changes in non-water quality ecosystem goods, services and attributes. 4Identify and evaluate scenarios within the integrated water resource management process. 5Evaluate the scenarios with stakeholders and determine Management Classes. 6Develop draft RQOs and numerical limits. 7Gazette and implement the class configuration and RQOs. Integrated steps combining the NWRC, RQO and Reserve processes
. 3 Quantify the Ecological Water Requirements and changes in non-water quality ecosystem goods, services and attributes. 4Identify and evaluate scenarios within the integrated water resource management process. 5Evaluate the scenarios with stakeholders and determine Management Classes. 6Develop draft RQOs and numerical limits. 7Gazette and implement the class configuration and RQOs. Integrated steps combining the NWRC, RQO and Reserve processes.")
7
RESERV E CLASSIFICATIO N RQOs

8
VALUE OF OPERATIONAL SCENARIOS? Scenarios are part of the EWR methods for estuaries and rivers when applying DRIFT. Should preferably be real, but can also be hypothetical. Estuaries: Need range of scenarios to ensure that one can test sensitivity of categories The scenarios determination as part of the Reserve process does not replace Classification – operational scenarios assessed in Classification is more comprehensive ito economic and social aspects. Scenarios in Reserve is basically to test sensitivities of the ecology to change and to provide some information for planning prior to Classification. Therefore, the focus should be on highly likely scenarios as Classification will deal with the rest.

9
A scenario is a definition or setting of all the factors (variables) that influence the water balance and water quality in a catchment and the system as a whole. Scenarios are used to assess different levels of water use and protection with the aim of finding a balance between ecological protection and utilisation of the resource. WHAT ARE OPERATIONAL SCENARIOS?

10
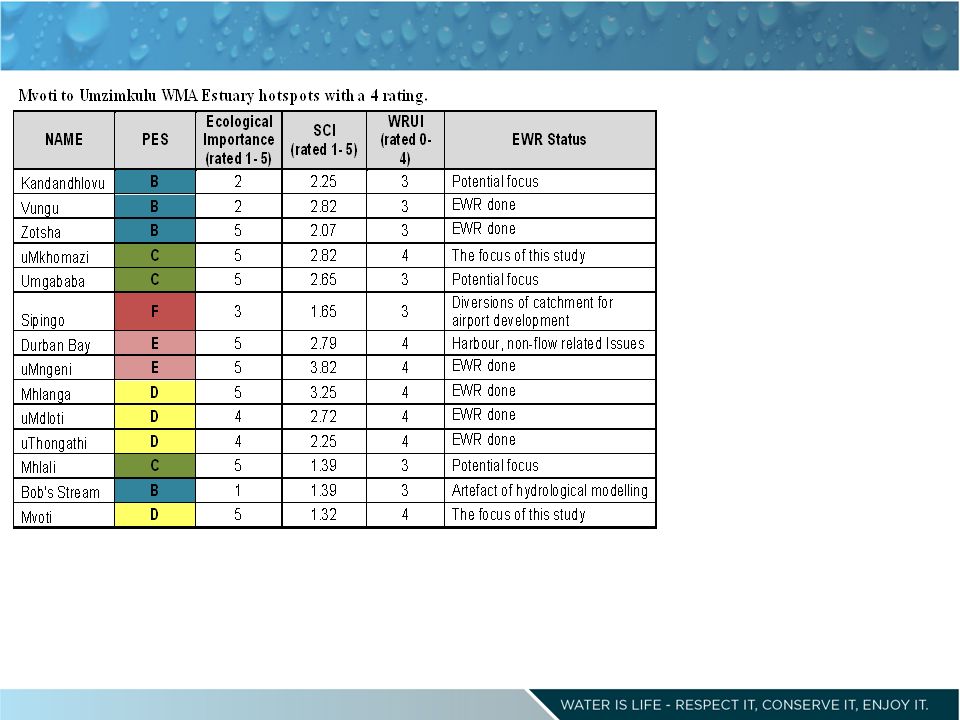
The results of the river desktop EWR assessments at 158 desktop biophysical nodes are provided. Detailed EWR assessments will be undertaken at 11 EWR sites which are key biophysical nodes. There are 14 existing EWR sites where detailed EWR assessments are available 37 nodes where results will be extrapolated from EWR sites. Sixty eight nodes will either be addressed by estuarine assessments or are located in protected areas and do not require EWR assessments. 2 High confidence Reserve for Mkomaas and Mvoti estuaries Operational scenarios be evaluated on hot spot systems RESERVE DETERMINATION

11
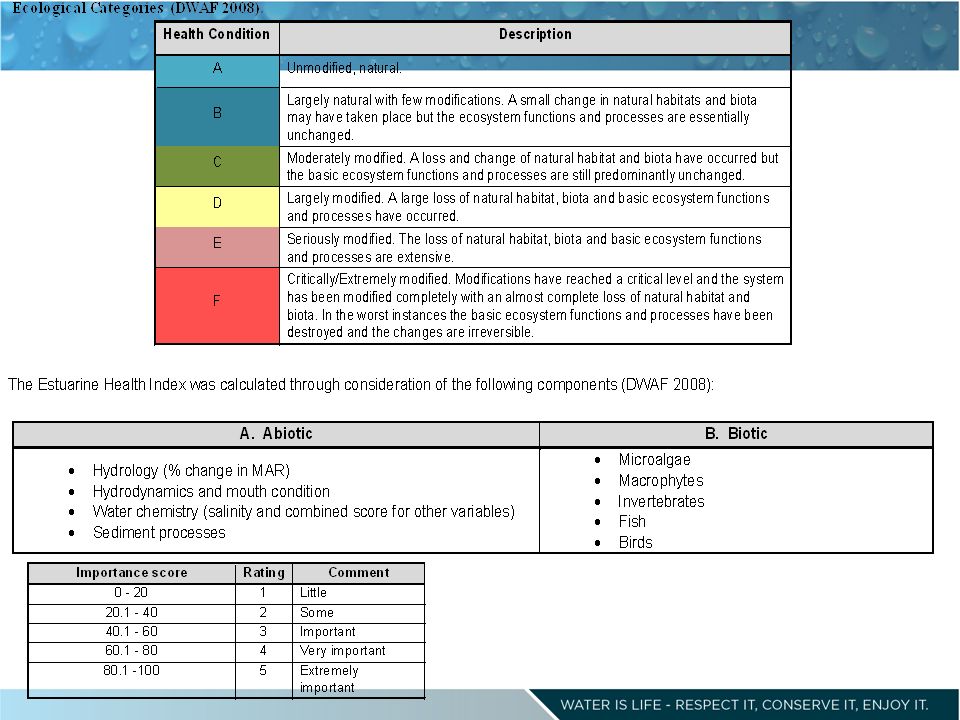
RECOMMENDED ECOLOGICAL CATEGORY

14
ESTUARYnMAR *1 pMAR *2 PESREC ECOLOGICAL & CONSERVATION IMPORTANCE FLOW WATER QUALITY NON-FLOW POTENTIAL FOR WATER RESOURCE DEVELOPMENT ASPECTS THAT NEEDS TARGETING FOR RESTORATION/REHABILITATION uMkhomazi1077.74926.05 CB 5XXX 5- 10% Significant flow reduction, poor water quality, habitat destruction Little aManzimtoti2.846.62 ED 3XXX Significant flow increase, poor water quality, habitat destruction aManzimtoti5.306.75 DD 3XXX Poor water quality, habitat destruction Mbokodweni31.5253.54 ED 3X X Very significant flow modification, very poor water quality, severe habitat destruction (restoration of the existing mouth and lower reaches of the estuary required). Durban Bay36.3363.44 ED 5XXX High fishing pressure, significant flow modification, poor water quality, severe habitat destruction (port development), reduced food availability uMngeni671.30262.68 ED 5XXX Significant flow modification, very poor water quality, severe habitat destruction Mhlanga13.3422.33 DB* 5XXX Significant flow modification, poor water quality, habitat destruction uMdloti85.7871.87 DC* 4 XX Flow modification, poor water quality, habitat destruction uThongathi70.7771.16 DD* 4 XX Very poor water quality, severe habitat destruction Mvoti420.00314.00 DD 5 XX<5% Poor water quality, habitat destruction Estuaries EWR and recommendations
, reduced food availability uMngeni ED 5XXX Significant flow modification, very poor water quality, severe habitat destruction Mhlanga DB* 5XXX Significant flow modification, poor water quality, habitat destruction uMdloti DC* 4 XX Flow modification, poor water quality, habitat destruction uThongathi DD* 4 XX Very poor water quality, severe habitat destruction Mvoti DD 5 XX<5% Poor water quality, habitat destruction Estuaries EWR and recommendations.")
15
Mdloti: PES=D NMAR: Mdloti is 85.78 - Reserve specified EWR = 88.26 wat (102.89%) off nMAR = scenario 3. Reserve is: Present discharges increased by 30 Ml/d (nutrient-free) with current demands and return flows, no irrigation demands considered. Base flows > in this scenario, the reason for the B hydrology score. Too little or to Much flow negative influence. Current condition a very low D as a result of WWTW return flow. The REC is a C based on the additional flow minus nutrients. Mdloti – Intermediate
 with current demands and return flows, no irrigation demands considered. Base flows > in this scenario, the reason for the B hydrology score. Too little or to Much flow negative influence. Current condition a very low D as a result of WWTW return flow. The REC is a C based on the additional flow minus nutrients. Mdloti – Intermediate.")
16
Tongati - Intermediate 7 Scenarios evaluated TONGATI PES = D. The EWR did recommend a C, but none of the flow scenarios would get it in that category. All ended in a D. The Recommended ‘Ecological Water Requirement Scenario’ for the Tongati Estuary is estimated at a MAR of 77.19 x 10⁶ m3 (Future 1 – 4.9 Mm3 p.a. for Zimbali) BUT THEN a NUMBER of NON FLOW RELATED IMPACTS NEED TO BE CONSIDERED. If not, it remains a D. If interventions are put in place it will actually go up to a B easily as it is a small estuary that will respond well to management interventions. Required actions: reduce anthropogenic influences such as flood plain development, sedimentation, the construction of illegal causeways and reduce nutrients from treatment water.
 BUT THEN a NUMBER of NON FLOW RELATED IMPACTS NEED TO BE CONSIDERED. If not, it remains a D. If interventions are put in place it will actually go up to a B easily as it is a small estuary that will respond well to management interventions. Required actions: reduce anthropogenic influences such as flood plain development, sedimentation, the construction of illegal causeways and reduce nutrients from treatment water..")
17
Mhlanga= Rapid 2003 PES=D REC=B Mhlanga to cap additional flow from WW discharge which is changing the characteristics of the mouth nMAR van 12.4 (2003) - 13.34( revised flows 2014). Classification specialist workshop found that the Mhlanga had slipped in condition (negative trajectory), REC of a B should remain. Mhlanga requires full protection according to the biodiversity targets set In theory a total of 8.96 (22.3 - 13.34) should be reduced. In practise it depends on the nutrient loading into the system. Estuary is very sensitive and only monitoring can show how it responds to reduced input and exactly how much can be taken out.
, REC of a B should remain. Mhlanga requires full protection according to the biodiversity targets set In theory a total of 8.96 ( ) should be reduced. In practise it depends on the nutrient loading into the system. Estuary is very sensitive and only monitoring can show how it responds to reduced input and exactly how much can be taken out..")
18
OVER UTILISATION OF A WATER RESOURCE Mbokodweni and Little Toti both a PES of E ( not sustainable) EWR
 EWR")
19
RQIS – national monitoring programes – Eutrophication – Microbial – Chemical – Radioactivity – Toxicological – Ecosystems – rivers and estuaries – Different drivers and response indicators Monitoring

20
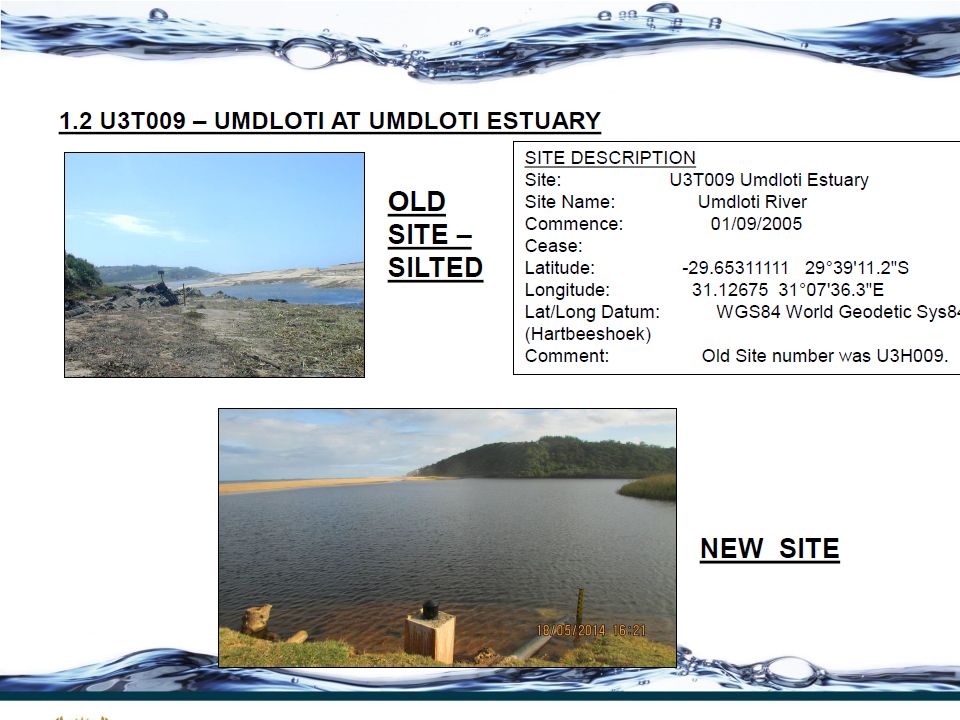
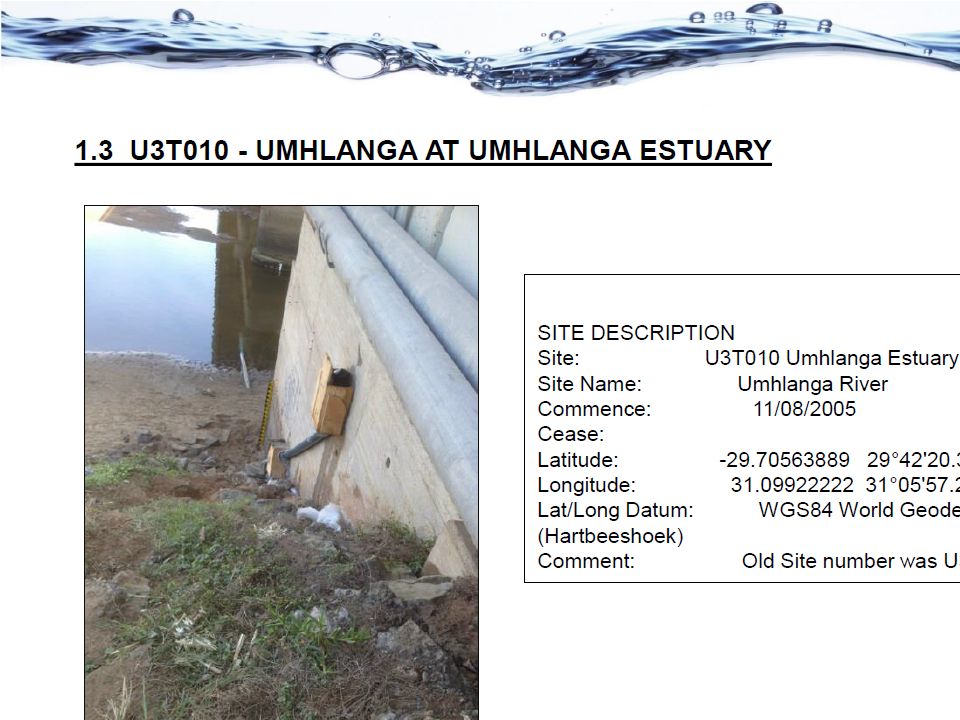
Critical data, i.e. continuous water level recorder data, for high confidence EWR assessments are only available for the following estuaries: uMkhomazi (U1T008), Mvoti (U4T011), uThongathi (U3T008), uMdloti (U3T009), and Mlanga (U3T010). Flow data are only available for the first four estuaries. Therefore, while all estuaries in the catchment are deemed ecologically and socially significant, and sensitive to water resources development, not all of them are under the same degree of pressure. The relevant government departments are therefore strongly urged to invest in the long-term monitoring programmes required to undertake higher level confidence EWR studies on the identified systems.
, Mvoti (U4T011), uThongathi (U3T008), uMdloti (U3T009), and Mlanga (U3T010). Flow data are only available for the first four estuaries. Therefore, while all estuaries in the catchment are deemed ecologically and socially significant, and sensitive to water resources development, not all of them are under the same degree of pressure. The relevant government departments are therefore strongly urged to invest in the long-term monitoring programmes required to undertake higher level confidence EWR studies on the identified systems..")
21
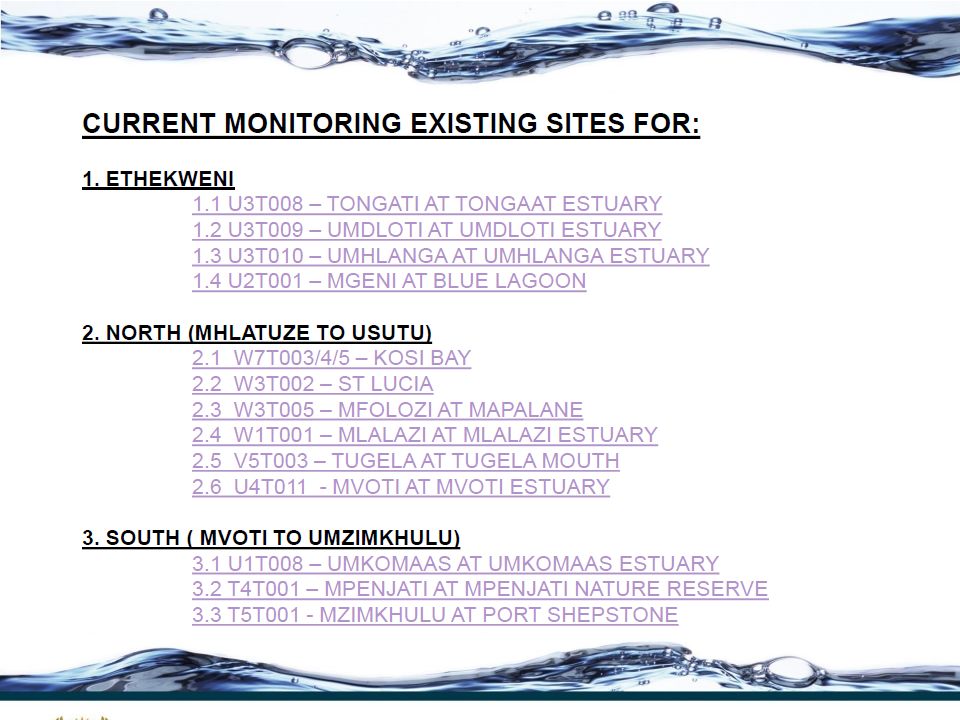
CURRENT MONITORING IN MVOTI TO UMZIMKULU WMA eThekwini meeting – DWA, eThekwini, DEA, Ezemvelo / KZN Wildlife – June 2014 Compilation of estuary monitoring matrix Create partnerships for future monitoring – build on existing partnerships with Ezemvelo / KZN Wildlife and Zinkwazi Consevancy Zinkwazi Nonoti Mhlanga Mgeni Mpenjati Mtamvuna Future estuarine monitoring Mbokodweni? Little Manzimtoti? Mdloti? To be determined after classification priorities been set Continuation with existing freshwater monitoring – RQIS national programmes – various stakeholders

22
MONITORING MATRIX ESTUARY EXPECTED DEVELOPMENT CURRENT LONG-TERM MONITORING (YES/NO) IF NO MONITORING WATER LEVEL RECORD? IF YES, WHICH LEVEL OF MONITORING AND WHICH ORGANISATION? RESERVES? WHICH ORGANISATION, TO APPROACH OR WILLING? MONIT REQ. TIER 1 (basic, water quality) TIER 2 (RDM protocol) TIER 3 (Situation specific, user specific) LEVEL AND YEAR OF COMPLETION TONGATI WWTW EXPAND, SAND MINING NOETHEKWINIH2O QUALITYYES INTERMEDIATE, 2007 MDLOTI RAISING DAM, WWTW, SAND MINING NOETHEKWINI H2O QUALITY, QUANT YES INTERMEDIATE, 2007 MHLANGASAND MININGYES EZEMVELO MERRAPID, 2004 MNGENISAND MININGYES EZEMVELO RAPID, 2011 MVOTIDAM PROPOSEDNO QUANT AND QUALITYES INR, SAPPI COMPREHENSIVE, 2015 MBOKODWENI LITTLE TOTI
 TIER 2 (RDM protocol) TIER 3 (Situation specific, user specific) LEVEL AND YEAR OF COMPLETION TONGATI WWTW EXPAND, SAND MINING NOETHEKWINIH2O QUALITYYES INTERMEDIATE, 2007 MDLOTI RAISING DAM, WWTW, SAND MINING NOETHEKWINI H2O QUALITY, QUANT YES INTERMEDIATE, 2007 MHLANGASAND MININGYES EZEMVELO MERRAPID, 2004 MNGENISAND MININGYES EZEMVELO RAPID, 2011 MVOTIDAM PROPOSEDNO QUANT AND QUALITYES INR, SAPPI COMPREHENSIVE, 2015 MBOKODWENI LITTLE TOTI.")
23
MONITORING MATRIX ESTUARY EXPECTED DEVELOPMENT CURRENT LONG-TERM MONITORING (YES/NO) IF NO MONITORING WATER LEVEL RECORD? IF YES, WHICH LEVEL OF MONITORING AND WHICH ORGANISATION? RESERVES? WHICH ORGANISATION, TO APPROACH OR WILLING? MONIT REQ. TIER 1 (basic, water quality) TIER 2 (RDM protocol) TIER 3 (Situation specific, user specific) LEVEL AND YEAR OF COMPLETION TONGATI WWTW EXPAND, SAND MINING NOETHEKWINIH2O QUALITYYES INTERMEDIATE, 2007 MDLOTI RAISING DAM, WWTW, SAND MINING NOETHEKWINI H2O QUALITY, QUANT YES INTERMEDIATE, 2007 MHLANGASAND MININGYES EZEMVELO MERRAPID, 2004 MNGENISAND MININGYES EZEMVELO RAPID, 2011 MVOTIDAM PROPOSEDNO QUANT AND QUALITYES INR, SAPPI COMPREHENSIVE, 2015 MBOKODWENI LITTLE TOTI
 TIER 2 (RDM protocol) TIER 3 (Situation specific, user specific) LEVEL AND YEAR OF COMPLETION TONGATI WWTW EXPAND, SAND MINING NOETHEKWINIH2O QUALITYYES INTERMEDIATE, 2007 MDLOTI RAISING DAM, WWTW, SAND MINING NOETHEKWINI H2O QUALITY, QUANT YES INTERMEDIATE, 2007 MHLANGASAND MININGYES EZEMVELO MERRAPID, 2004 MNGENISAND MININGYES EZEMVELO RAPID, 2011 MVOTIDAM PROPOSEDNO QUANT AND QUALITYES INR, SAPPI COMPREHENSIVE, 2015 MBOKODWENI LITTLE TOTI.")
Similar presentations

 3 April 2014.>")


>")


