Download presentation
Presentation is loading. Please wait.

1
Natural and human induced changes in the water cycle: Relative magnitudes and trends Dennis P. Lettenmaier Department of Geography University of California, Los Angeles American Geophysical Union Fall Meeting Dec 15, 2014

2
“Natural” water cycle trends Over land (~30% of global surface area) Some evidence of increased precipitation (esp. mid-latitude Northern Hemisphere) Streamflow trends somewhat less apparent (but some evidence of trends in the mean and low flows over U.S. ET – trends less clear (weak observation basis, results tend to be model dependent) Snow – increasing temperature trends (strong evidence over land, esp. high latitude) are leading to earlier melt and reduced spatial extent (maximum storage trends less obvious)
 Streamflow trends somewhat less apparent (but some evidence of trends in the mean and low flows over U.S. ET – trends less clear (weak observation basis, results tend to be model dependent) Snow – increasing temperature trends (strong evidence over land, esp. high latitude) are leading to earlier melt and reduced spatial extent (maximum storage trends less obvious).")
3
But what does “natural” mean For this presentation, not land cover change (hence indirect possible effects on precipitation) Climate change associated with greenhouse gas emissions but rather: direct movement (e.g., irrigation, municipal and industrial consumptive use) of water or its storage (in reservoirs mostly)
 Climate change associated with greenhouse gas emissions but rather: direct movement (e.g., irrigation, municipal and industrial consumptive use) of water or its storage (in reservoirs mostly)")
4
Global land water balance (per Eric Wood) P: 774 mm = 102,800 km 3 ET: 488 mm = 64,800 km 3 RO: 288 mm – 38,200 km 3
 P: 774 mm = 102,800 km 3 ET: 488 mm = 64,800 km 3 RO: 288 mm – 38,200 km 3")
5
Annual Water Balance for Major Continental Land Areas source: unknown

6
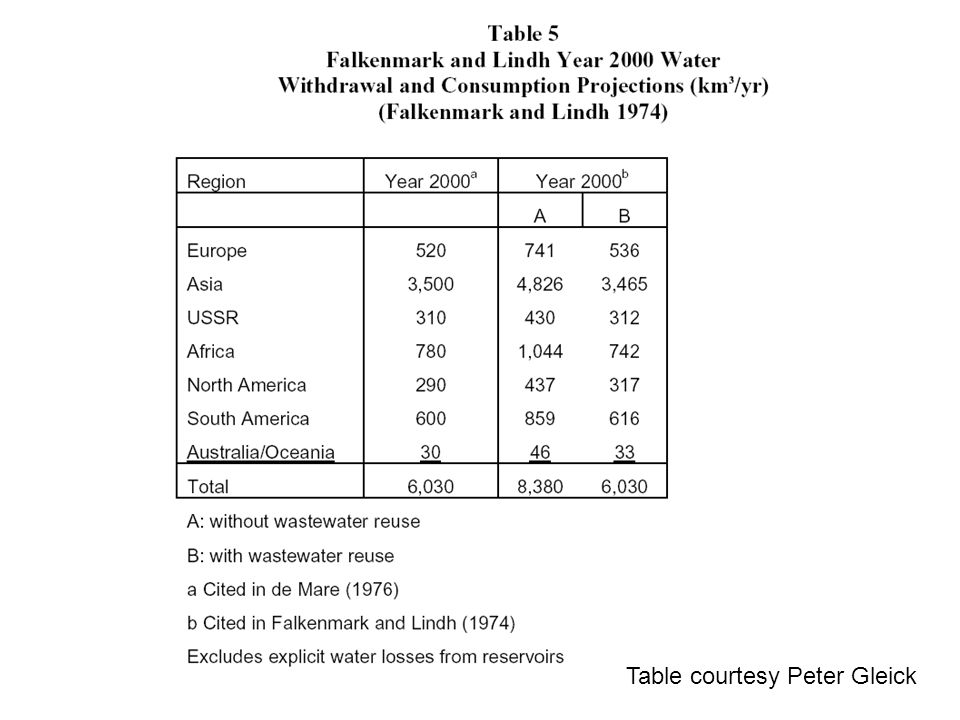
Table courtesy Peter Gleick

8
Irrigation water consumption Per WATCH project, visual courtesy Ingjerd Haddeland

9
Potential global irrigation consumptive use (per WATCH project)
")
10
Per WATCH project, visual courtesy Ingjerd Haddeland Irrigation consumptive use estimated seasonal cycle

11
Potential and actual irrigation consumptive use Potential consumption LPjML: 930 km 3 year -1 VIC: 1100 km 3 year -1 Actual consumption LPjML: 600 km 3 year -1 VIC: 780 km 3 year -1 Per WATCH project, visual courtesy Ingjerd Haddeland

12
Location of the model simulated basins and reservoirs 32 basins, 166 large reservoirs with total capacity 3900 km 3 From Zhou et al., 2014; see also poster GC13E-0684

13
Seasonal reservoir storage variation ranges for 23 global reservoirs Satellite observed (Gao et. al. 2012) vs Simulated (This study) From Zhou et al., 2014; see also poster GC13E-0684
 vs Simulated (This study) From Zhou et al., 2014; see also poster GC13E")
14
Simulated reservoir storage capacity for 32 global basins From Zhou et al., 2014; see also poster GC13E-0684

15
Reservoir storage seasonal variation as a fraction of (soil moisture + SWE) variation Lena Shatt al Arab Yellow
 variation Lena Shatt al Arab Yellow")
16
The seasonal reservoir storage variation range compared with seasonal SWE and soil moisture in Northern (a) and Southern (b) Hemisphere and five continents (c-g) (Normalized by subtracting the minimum value). From Zhou et al., 2014; see also poster GC13E-0684

17
Global reservoir storage time series along with total reservoir capacity 1948-2010. Black bars show variation range within each year

18
Summary At the global level, convergence to o(10-15%) level on primary water balance components Consumptive use estimates vary widely, more recent model based estimates tend to be much lower than earlier published values We’re only beginning to get a handle on reservoir storage variations at continental scales, but for the two continents with largest relative storage, variations appear to be o(20%) of soil moisture, 10% of snow
 level on primary water balance components Consumptive use estimates vary widely, more recent model based estimates tend to be much lower than earlier published values We’re only beginning to get a handle on reservoir storage variations at continental scales, but for the two continents with largest relative storage, variations appear to be o(20%) of soil moisture, 10% of snow")
Similar presentations


>")


 Water Resources (from IPCC WG-2, Chapter 3) Water Resources Primary Source: IPCC WG-2 Chapter 3 – Freshwater.>")

