Download presentation
Presentation is loading. Please wait.

1
Radiative Forcing and Global Warming Potentials due to CH 4 and N 2 O Hua Zhang Ruoyu Zhang National Climate Center China Meteorological Administration April 3-4, 2012 Bonn, Germany Workshop on common metrics to calculate the CO2 equivalence of anthropogenic greenhouse gas emissions by sources and removals by sinks

2
Backgrounds Data & Methods Radiative forcings GWPs & GTPs Discussion 2 4 3 5 2 1

3
10000 5000 0 year ( before 2005 ) C0 2 (ppmv) CH 4 (pptv) N 2 0 (pptv) Concentrations of main GHGs before 2005
 C0 2 (ppmv) CH 4 (pptv) N 2 0 (pptv) Concentrations of main GHGs before 2005")
4
Concentrations of main GHGs under SRES scenarios

5
气候变化的一种机制 通过辐射传输过程

7
1 GWP is related to emission process of GHG; 2 GWP can convert any kind of GHG equivalently to CO 2 emission, which makes the comparison easily among different gases; 3 GWP denotes the cumulative climate effect of the GHG during a period of time. RF of GHG x RF of CO 2 Radiative efficiency Time- decaying functions

8
1 GTP refers to emission process of GHGs too ; 2 GTP can convert any kind of GHGs equivalently to CO2 emission too; 3GTP denotes the effect of GHG on the temperature changes of the earth-atmosphere system. T changes with time Surface temperature changes T arrives at balance not varying

9
998-band longwave radiative transfer scheme (high resolution) 10~49000cm -1 (0.2~1000µm) is divided into 998 bands longwave region 10~2500cm -1 (4~1000µm ) is 498 bands with intervals of 5cm -1 Radiative Transfer Model (Zhang et al., 2003; 2006a,b)
 10~49000cm -1 (0.2~1000µm) is divided into 998 bands longwave region 10~2500cm -1 (4~1000µm ) is 498 bands with intervals of 5cm -1 Radiative Transfer Model (Zhang et al., 2003; 2006a,b)")
10
6 kinds of typical model atmosphere : TRO 、 MLS 、 MLW 、 SAS 、 SAW 、 USS HITRAN2004 辐射传输模式 Gas molecular spectrum data Atmosphere profiles data Clouds ISCCP D2 products

11
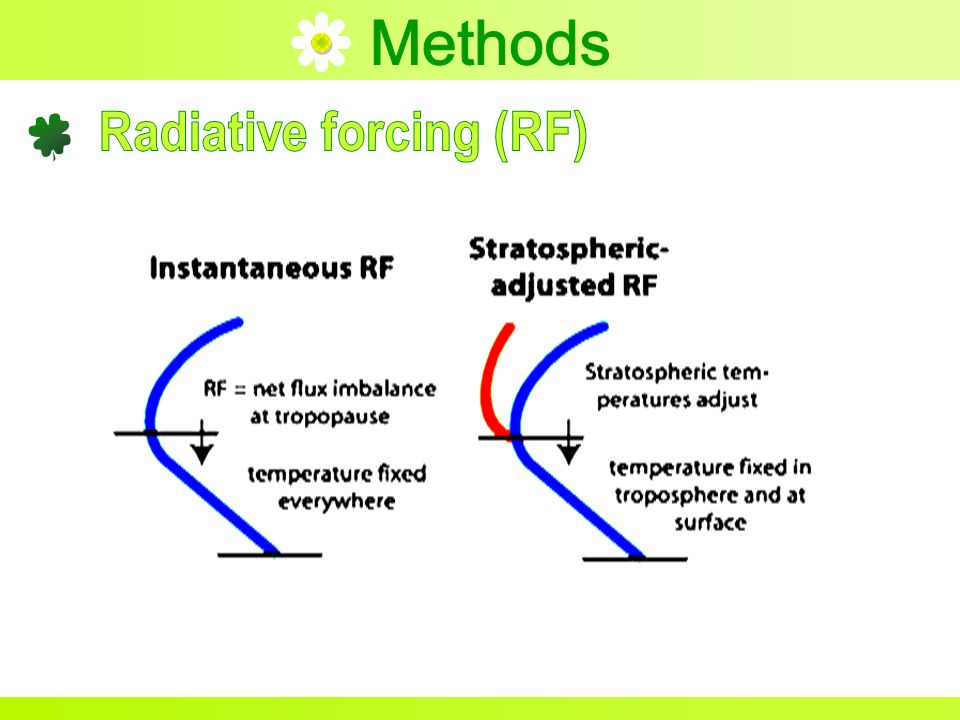
htrdif ( L ) < ξ N Y Radiative Transfer Model (Zhang et al. , 2006) Heating rate for zero concentration: htr0(L) Heating rate Htrdif ( L ) =htr1(L) - htr0(L) T new ( L ) =T old ( L ) +htrdif ( L ) × △ t L : from Tropopause to TOA Adjusted RF Heating rate for 0.1 ppbv concentration: htr1(L) Temperature profile T 0 (L) Radiative Transfer Model (Zhang et al. , 2006) iteration kn=kn+1 kn=0 Instantaneous RF kn=0 Criterion: to judge whether the system reaches to balance
 Heating rate for zero concentration: htr0(L) Heating rate Htrdif ( L ) =htr1(L) - htr0(L) T new ( L ) =T old ( L ) +htrdif ( L ) × △ t L : from Tropopause to TOA Adjusted RF Heating rate for 0.1 ppbv concentration: htr1(L) Temperature profile T 0 (L) Radiative Transfer Model (Zhang et al. , 2006) iteration kn=kn+1 kn=0 Instantaneous RF kn=0 Criterion: to judge whether the system reaches to balance.")
12
( 1 ) CO 2 concentration is doubled from 287 ppmv to 574 ppmv ; ( 2 ) With doubled CO 2 concentration (574 ppmv), H 2 O content is increased by 20% of its concentration of 1860 year Doubled CO 2 Doubled CO 2, H 2 O increase by 20% Model layer 998- band AOGCMsLBL998-bandAOGCMsLBL TOM 3.032.452.83.263.753.78 200 hPa 5.65.075.484.134.454.57 Surface 1.71.121.6411.1411.9511.52
 CO 2 concentration is doubled from 287 ppmv to 574 ppmv ; ( 2 ) With doubled CO 2 concentration (574 ppmv), H 2 O content is increased by 20% of its concentration of 1860 year Doubled CO 2 Doubled CO 2, H 2 O increase by 20% Model layer 998- band AOGCMsLBL998-bandAOGCMsLBL TOM hPa Surface")
13
Gas Clear skyCloudy sky IPCC 2007 IREARE ARE after lifetime- adjustment ARE CO 2 1.99E-51.88E-51.64E-51.57E-5, +11.9%1.4E-5 CH 4 5.13E-45.06E-44.14E-43.73E-4, +0.8%3.7E-4 N2ON2O3.87E-33.79E-33.13E-32.98E-3, -1.4%3.03E-3 * unit : W·m -2 ·ppbv -1 ** Lifetime : CO 2 : 120a ; CH 4 : 12a ; N 2 O : 114a Radiative efficiency

14
Gas 20052010 IPCC 2007 before adjustment After adjustment Before adjustment After adjustment CO 2 1.891.812.041.951.66±0.17 CH 4 0.5810.5230.5830.5250.48±0.05 N2ON2O 0.1850.1770.1870.1790.16±0.02 * unit : W·m -2 ** Lifetime : CO 2 : 120a ; CH 4 : 12a ; N 2 O : 114a Radiative forcings (ARF)
")
15
Climate sensitivity parameter : λ Its typical value is chosen as 0.5K·(W·m -2 ) -1 Original concentration of CO 2 : 385.2 ppmv Then: Concentration ARF / W m -2 Temperature Changes / K CO 2 ×1.5 2.81.4 CO 2 ×2.0 4.82.4 CO 2 ×2.5 6.43.2 CO 2 ×3.0 7.83.9 CO 2 ×3.5 9.04.5 CO 2 ×4.0 9.84.9 IPCC : 1.5~4.5K
 -1 Original concentration of CO 2 : ppmv Then: Concentration ARF / W m -2 Temperature Changes / K CO 2 × CO 2 × CO 2 × CO 2 × CO 2 × CO 2 × IPCC : 1.5~4.5K")
16
C : CO 2 concentration; C 0 : background CO 2 concentration, C 0 = 385.2 ppmv; fitting parameters : α=6.2554, β=5.2783×10 -2 ARF fitting formula

17
6 种大气廓线下 CH 4 background concentration M 0 =1797ppbv; 0≤M 0,N 0 ≤10000 ppbv ; fitting parameters : α=0.03195, β=1.439×10 -4, γ=-1.133×10 -3, δ=1.221×10 -7 N 2 O background concentration N 0 =321.8ppbv 0≤M 0,N 0 ≤10000 ppbv; fitting parameters : α=0.08801, β=0.0011 γ=-3.7167×10 -4, δ= 2.0116×10 -9 ARF fitting formula

18
Test of fitting Test issue Model results / W m -2 Formula results / W m -2 Absolute error / W m -2 CO 2 ×2 + CH 4 ×2 + N 2 O×2 6.076.050.02 CO 2 ×2 + CH 4 ×1 + N 2 O×1 4.704.760.06 CO 2 ×2 + CH 4 ×2 + N 2 O×1 5.365.300.06 CO 2 ×1 + CH 4 ×2 + N 2 O×2 1.321.290.03 * Shi et al., absolute error≤0.05 W m -2

19
Gas GWP IPCC 2007 GTP P GTP S 20 / 100 / 500 CH 4 50 / 17 / 5.372 / 25 / 7.641 / 0.26 / ~056 / 19 / 5.4 N2ON2O258 / 265.7 / 137289 / 298 / 153268 / 233 / 11250 / 269 / 139 after atmospheric lifetime adjustment before atmospheric lifetime adjustment 气体 GWP IPCC 2007 GTP P GTP S 20 / 100 / 500 CH 4 47 / 16 / 572 / 25 / 7.639 / 0.24 / ~053 / 18 / 5 N2ON2O257 / 266 / 136289 / 298 / 153268 / 233 / 11250 / 268 / 138

20
Gas Analytical calculationEBM GTP P GTP S GTP P GTP S 20 / 100 / 500 CH 4 52 / 0.35 / 069 / 24 / 746 / 5 / 0.866 / 25 / 8 N2ON2O290 / 270 / 13260 / 290 / 160290 / 270 / 35270 / 290 / 160 Shine ( 2005 ) results For comparison :
 results For comparison :")
21
Gas Atmosphere lifetime /a AGWP / 10 -14 ·W·m -2 ·kg -1 20 / 100 / 500 CO 2 1202.72 / 9.57 / 31.5 CH 4 12127.7 / 157.3 / 157.4 N2ON2O 114700.3 / 2542 / 4298 HFC-32 4.96613 / 6727 / 6727 HFC-125 2919971 / 38808 / 40083 HFC-134 1012962 / 14990 / 14991 HFC-134a 1412320 / 16191 / 16204 HFC-143a 5224107 / 64468 / 75499 HFC-152a 1.41573 / 1573 / 1573 C2F6C2F6 1000028168 / 140277 / 68757 CF 4 5000012527 / 62553 / 311520 SF 6 320052193 / 257734 / 1211774 After the lifetime-adjustment

22
Gas AGTP P / 10 -16 ·K·kg -1 AGTP S / 10 -14 ·K·kg -1 20 / 100 / 500 CH 4 372 / 1.62 / ~073.8 / 139.5 / 139.7 N2ON2O2419 / 1465 / 43.9328.9 / 1972 / 3593 CO 2 9.04 / 6.28 / 3.891.31 / 7.34 / 25.9 After atmospheric lifetime adjustment Before atmospheric lifetime adjustment Gas AGTP P / 10 -16 ·K·kg -1 AGTP S / 10 -14 ·K·kg -1 20 / 100 / 500 CH 4 336 / 1.46 / ~066.5 / 125.7 / 125.9 N2ON2O2312 / 1401 / 41.9314 / 1884 / 3434 CO 2 8.64 / 6.01 / 3.721.26 / 7.02 / 24.8

23
Gas AGTP P / 10 -16 ·K·kg -1 AGTP S / 10 -14 ·K·kg -1 20 / 100 / 500 HFC-32 16834 / 10.2 / ~05209 / 7118 / 7119 HFC-125 80622 / 7321 / 0.00812550 / 40266 / 42393 HFC-134 35691 / 59.9 / ~08093 / 14012 / 14021 HFC-134a 44445 / 361 / ~08322 / 17108 / 17160 HFC-143a 46423 / 12837 / 5.913945 / 62032 / 75986 HFC-152a 2755 / 1.5 / ~01376 / 1669 / 1669 C2F6C2F6 124990 / 146336 / 14061016213 / 131366 / 705206 CF 4 51547 / 60720 / 602416683 / 143168 / 296248 SF 6 233196 / 268627 / 23708330283 / 243422 / 1253570

24
AGTP S of CH 4 & N 2 O AGTP P of CH 4 & N 2 O

25
AGTP S of CO 2 AGTP P of CO 2 Temperature changes (10 -16 K) Temperature changes (10 -14 K) Time (a)
 Temperature changes ( K) Time (a)")
26
The lifetimes of CH 4 are relatively short-lived GHGs; GWP greatly over-estimates the effects of their pulse emission on climate changes. GTPp is an optimal metric for assessing the long-term effects of CH 4 emissions on global climate change, by considering practical emissions of these gases.

27
Climate sensitivity parameter λ can affect AGWP and AGTP greatly, this should be considered as a large uncertainty in estimating process. AGWPs and AGTPs of long-lived GHGs are sensitive to time horizon; while AGTPp of short-lived GHGs is sensitive to time horizon greatly. Clouds is another large factor of uncertainties in estimating GWP or GTP and should be clarified in IPCC AR5 report.

28
Thanks !

Similar presentations


 tell us – What are trends in the current observational.>")


![CHAPTER 7: THE GREENHOUSE EFFECT. MILLENIAL NH TEMPERATURE TREND [IPCC, 2001]](/16/5012537/big_thumb.jpg "CHAPTER 7: THE GREENHOUSE EFFECT. MILLENIAL NH TEMPERATURE TREND [IPCC, 2001]>")
 The Greenhouse Effect Climate Forcings Aerosols, Clouds and the.>")
