Download presentation
Presentation is loading. Please wait.

1
Chapter 12 Analysis Modeling

2
Analysis Modeling A set of models: data, function, and behavior
Combination of text and diagrammatic forms Different points of view. Reviewed Work products: data object descriptions, entity relationship diagrams, …. Methods: Structured, Object-oriented, and others A set of models: data, function, and behavior The first technical representation of a system Methods: Structured, Object-oriented, and others Combination of text and diagrammatic forms Examine the software requirements from different points of view. Represent requirements in three “dimensions” – data, function, and behavior Must be reviewed Work products: data object descriptions, entity relationship diagrams, ….

3
Structure of Analysis model
Analysis modeling: structured analysis & object-oriented analysis Primary objectives: To describe what the customer requires To establish a basis for the creation of a software design To define a set of requirements that can be validated once the software is built.

4
=========================

5
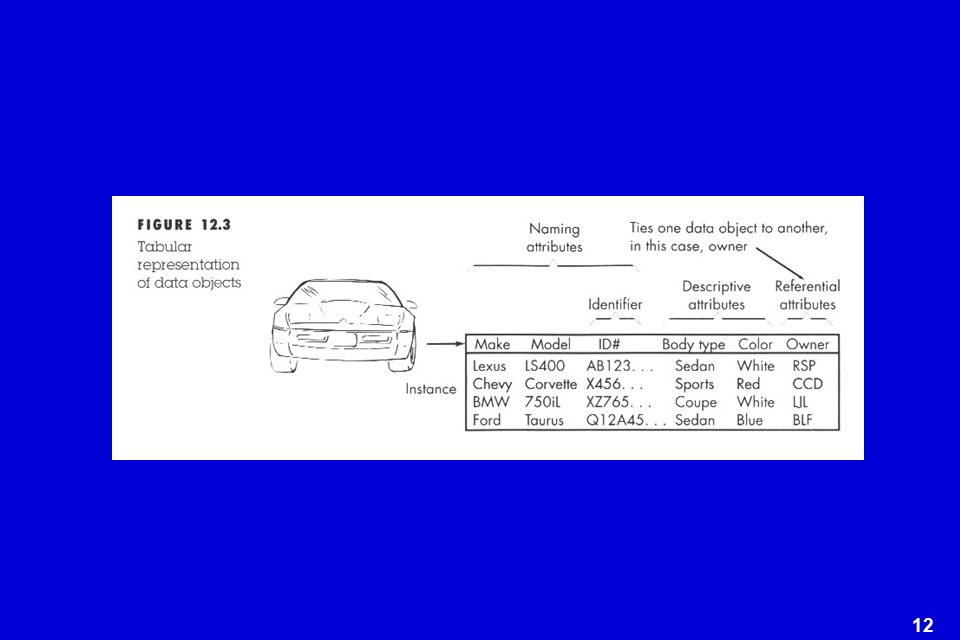
Data Modeling The elements of data modeling – data objects, attributes, and relationships

6
Data Modeling Analysis modeling: structured analysis & object-oriented analysis Primary objectives: To describe what the customer requires To establish a basis for the creation of a software design To define a set of requirements that can be validated once the software is built.

7
Why Data Modeling? examines data objects independently of processing
focuses attention on the data domain creates a model at the customer’s level of abstraction indicates how data objects relate to one another

8
What is a Data Object? Object —something that is described by a set
of attributes (data items) and that will be manipulated within the software (system) each instance of an object (e.g., a book) can be identified uniquely (e.g., ISBN #) each plays a necessary role in the system i.e., the system could not function without access to instances of the object each is described by attributes that are themselves data items
 and that will be. manipulated within the software (system) each. instance. of an object (e.g., a book) can be identified uniquely (e.g., ISBN #) each plays a necessary role in the system. i.e., the system could not function without. access to instances of the object. each is described by attributes that are. themselves data items.")
9
Typical Objects external entities (printer, user, sensor) things
(e.g, reports, displays, signals) occurrences or events (e.g., interrupt, alarm) roles (e.g., manager, engineer, salesperson) organizational units (e.g., division, team) places (e.g., manufacturing floor) structures (e.g., employee record)
 occurrences or events (e.g., interrupt, alarm) roles. (e.g., manager, engineer, salesperson) organizational units. (e.g., division, team) places. (e.g., manufacturing floor) structures (e.g., employee record)")
10
Identifying Objects and Operations
define “objects” by underlining all nouns in the written statement of scope producers/consumers of data places where data are stored “composite” data items define “operations” by double underlining all active verbs processes relevant to the application data transformations consider other “services” that will be required by the objects

11
Data Objects and Attributes
A data object contains a set of attributes that act as an aspect, quality, character-istic, or descriptor of the object object: automobile attributes: make model body type price options code

13
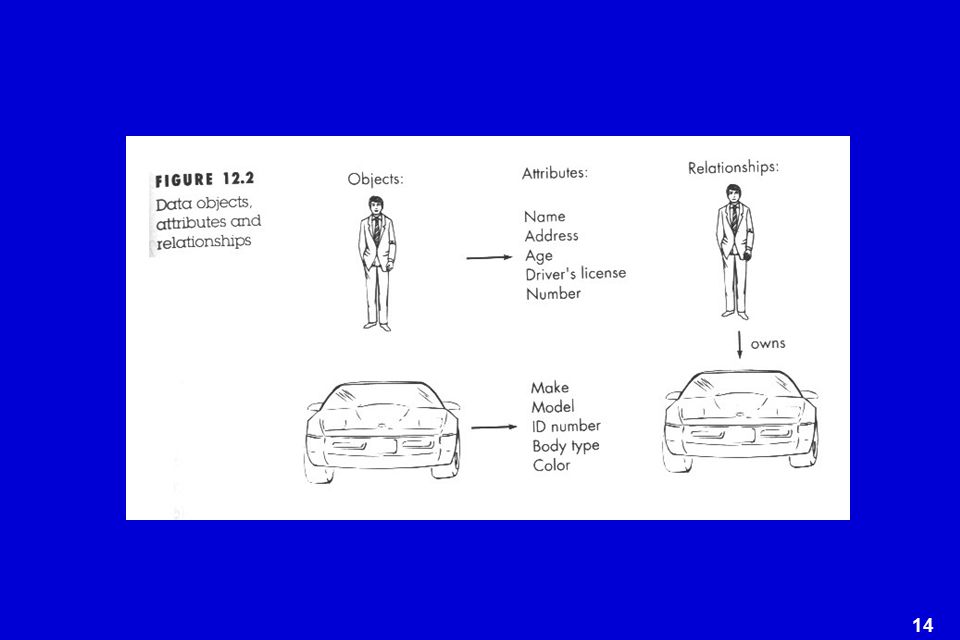
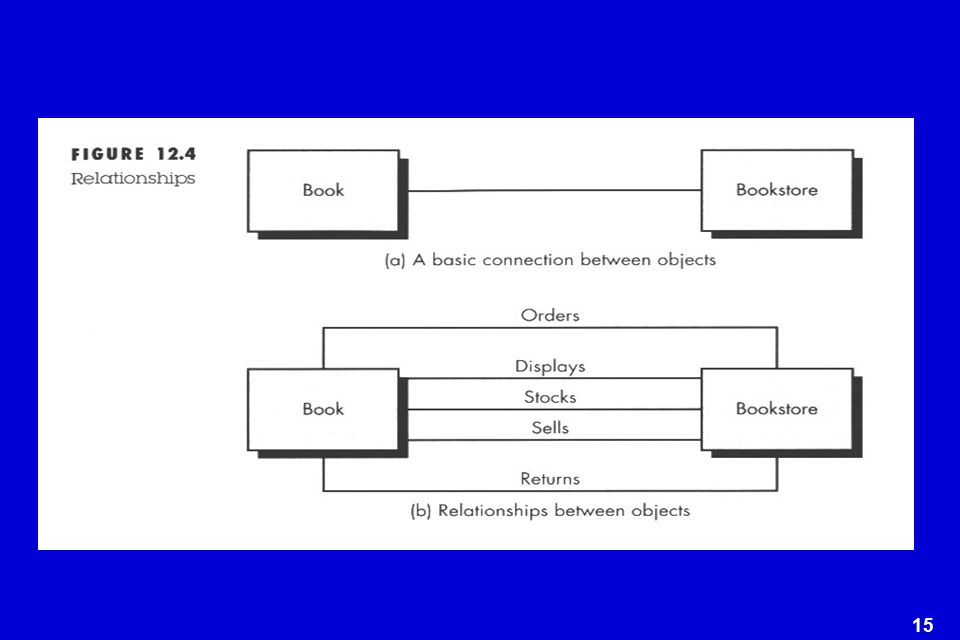
What is a Relationship? relationship —indicates “connectedness”;
a "fact" that must be "remembered" by the system and cannot or is not computed or derived mechanically several instances of a relationship can exist objects can be related in many different ways

16
Cardinality & Modality
Cardinality: define the maximum number of objects that can participate in a relationship Modality: the modality of a relationship is 0 if there is no explicit need for the relationship to occur or the relationship is optional. 1 if mandatory.

17
The ERD: An Example (1)
")
18
The ERD: An Example (2) request for service Customer places (1,1)
standard task table (1,n) work order generates (1,1) (1,1) (1,1) selected from work tasks (1,w) consists of (1,w) (1,i) materials lists
 work. order. generates. (1,1) (1,1) (1,1) selected. from. work. tasks. (1,w) consists. of. (1,w) (1,i) materials. lists.")
19
Data Object Type Hierarchies

20
Associative Data Object

21
=========================

22
Function Modeling (function model = information model = Data Flow Diagram(DFD) ) <> flowchard
 ) <> flowchard")
23
Function Modeling Analysis modeling: structured analysis & object-oriented analysis Primary objectives: To describe what the customer requires To establish a basis for the creation of a software design To define a set of requirements that can be validated once the software is built.

24
The Flow Model Every computer-based system is an
information transform .... computer based system input output

25
Flow Modeling Notation
external entity process data flow data store

26
External Entity A producer or consumer of data
Examples: a person, a device, a sensor Another example: computer-based system Data must always originate somewhere and must always be sent to something

27
Process A data transformer (changes input to output)
Examples: compute taxes, determine area, format report, display graph Data must always be processed in some way to achieve system function

28
Data Flow Data flows through a system, beginning
as input and be transformed into output. base compute triangle area area height

29
Data Stores Data is often stored for later use. sensor #
sensor #, type, location, age look-up sensor data report required type, location, age sensor number sensor data

30
Example Information is transformed as it flows through a computer-based system. DFD is a graphical representation that depicts that depicts information flow and the transforms that are applied as data mave from input to output. (function model = information model = Data Flow Diagram(DFD) ) <> flowchard
 ) <> flowchard.")
31
Constructing a DFD—I review ERD to isolate data objects and grammatical parse to determine “operations” determine external entities (producers and consumers of data create a level 0 DFD

32
Level 0 DFD Example processing request user requested video signal
digital video processor monitor video source NTSC video signal Level 0 DFD (called fundamental system model/context model) represents the entire software element as a single bubble with input and output data indicated by incoming and outgoing arrows, respectively.
 represents the entire software element as a single bubble with input and output data indicated by incoming and outgoing arrows, respectively.")
33
Constructing a DFD—II write a narrative describing the transform
parse to determine next level transforms “balance” the flow to maintain data flow continuity develop a level 1 DFD “balance” the flow to maintain data flow continuity: input and output to each refinement must remain the same..

34
The Data Flow Hierarchy
b x P y level 0 c a p2 f p1 b p4 d 5 g p3 e level 1

35
DFDs: A Look Ahead analysis model Maps into design model

36
Data Flow Diagramming: Guidelines
all icons must be labeled with meaningful names the DFD evolves through a number of levels of detail always begin with a context level diagram (also called level 0) always show external entities at level 0 always label data flow arrows do not represent procedural logic
 always show external entities at level 0. always label data flow arrows. do not represent procedural logic.")
37
=========================

38
Behavioral Modeling

39
Behavior Modeling Analysis modeling: structured analysis & object-oriented analysis Primary objectives: To describe what the customer requires To establish a basis for the creation of a software design To define a set of requirements that can be validated once the software is built.

40
Behavioral Modeling events behavior Outside world Application

41
Real-Time Analysis Methods
each introduces its own notation, but all propose an approach for representing control and separating it from data provide a mechanism for specifying events, states, and distributed processing begin at the analysis level and work to derive processor assignments, tasks and program architectures

42
Control Flow Diagram (CFD)
the control flow diagram is "superimposed" on the DFD and shows events that control the processes noted in the DFD control flows—events and control items—are noted by a vertical bar implies an input to or output from a control dashed arrows spec (CSPEC) — a separate specification that describes how control is handled a dashed arrow entering a vertical bar is an input to the CSPEC a dashed arrow leaving a process implies a data condition a dashed arrow entering a process implies a control input read directly by the process control flows do not physically activate/deactivate the processes—this is done via the CSPEC
 — a separate specification that. describes how control is handled. a dashed arrow entering a vertical bar is an input to the. CSPEC. a dashed arrow leaving a process implies a data. condition. a dashed arrow entering a process implies a control. input read directly by the process. control flows do not physically activate/deactivate the. processes—this is done via the CSPEC.")
43
Example

44
Extensions for Real-Time Systems Ward & Mellor

45
Example

46
Extensions for Real-Time Systems Hatley & Pirbhai

47
Example

49
The States of a System state—a set of observable circum-stances that characterizes the behavior of a system at a given time state transition—the movement from one state to another event—an occurrence that causes the system to exhibit some predictable form of behavior action—process that occurs as a consequence of making a transition

50
State Transition Diagram (STD)
make a list of the different states of a system (How does the system behave?) indicate how the system makes a transition from one state to another (How does the system change state?) indicate event indicate action draw a state transition diagram
 indicate how the system makes a transition from one state to another (How does the system change state ) indicate event. indicate action. draw a state transition diagram.")
51
State Transition Diagram Notation
event causing transition action that occurs new state

52
Example full and start reading invoke manage-copying operator commands
making copies reloading paper problem state full invoke read-op-input full and start invoke manage-copying copies done empty invoke reload paper not jammed jammed invoke problem-diagnosis

53
=========================

54
Data Dictionary The data dictionary has been proposed as a quasi-formal grammar for describing the content of objects defined during structured analysis.

55
Data Dictionary Analysis modeling: structured analysis & object-oriented analysis Primary objectives: To describe what the customer requires To establish a basis for the creation of a software design To define a set of requirements that can be validated once the software is built.

56
The Data Dictionary CASE: structured analysis and Design tool

57
Information Name: the primary name of the composite data item Aliases:
other names for the data item Where used: data transforms (processes) that use the composite data item How used: the role of the data item (input, output, temporary storage, etc. Description: a notation for representing content (presented on next slide) Supplementary information: specific information about data types, pre-set values (if known) Although the format of dictionaries varies from tool to tool, most contain the following information.
 that use the. composite data item. How used: the role of the data item (input, output, temporary storage, etc. Description: a notation for representing content (presented. on next slide) Supplementary. information: specific information about data types, pre-set values (if known) Although the format of dictionaries varies from tool to tool, most contain the following information.")
58
Data Dictionary Notation

59
Example Build the requirements dictionary: Dial phone telephone number
Telephone number tones Build the requirements dictionary: Name: Telephone number Aliases: none Where/How Assess against set-up (output) used: Dial phone (input) Description: telephone no. = [ local number | long distance number ] local number = prefix + access number long distance number = 1+ area code +local number area code = [800 | 888 | 561] prefix = *a three digit number that never starts with 0 or 1* access number = *any four number string* Format: alphanumeric data
 used: Dial phone (input) Description: telephone no. = [ local number | long distance number ] local number = prefix + access number. long distance number = 1+ area code +local number. area code = [800 | 888 | 561] prefix = *a three digit number that never starts with 0 or 1* access number = *any four number string* Format: alphanumeric data.")
60
%%%%%%%%%%%%%%%%%%%%%

61
The Mechanics of Structure Analysis

62
Data Modeling

63
ERD

64
DOD

65
%%%%%%%%%%%%

66
Function Modeling

67
1. Level 0 DFD

68
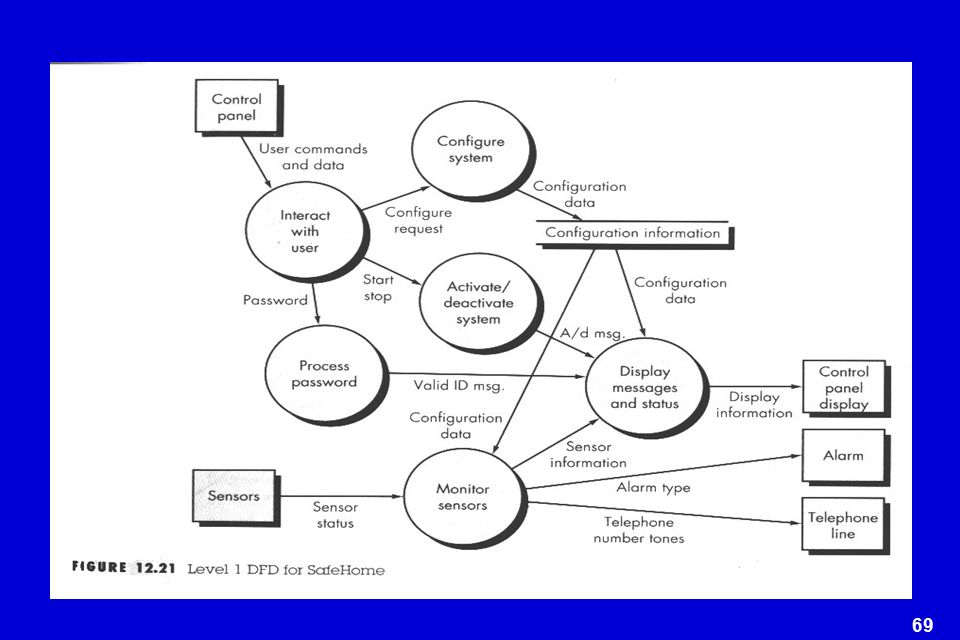
2. Level 1 DFD Underline the first occurrence of all nouns and italicize the first occurrence of all verbs. Example: ….SafeHome software enables the homeowner to configure the security system when it is installed, monitors all sensors connected to the security system, and interacts with the homeowner through a key pad and function keys contained in the SafeHome control panel…

70
3. Level 2 DFD

71
Process Specification (PSPEC)
bubble PSPEC narrative pseudocode (PDL) equations tables diagrams and/or charts
 equations. tables. diagrams and/or charts.")
72
Creating Mini-Specs Software Specification

73
Creating a Process Specification (PSPEC)
Using PDL

74
%%%%%%%%%%%

75
Behavior Modeling

76
Control Flow Diagram

77
Control Specification (CSPEC)
The CSPEC can be: state transition diagram process activation tables combinatorial spec decision tables state transition table

78
Guidelines for Building a CSPEC
list all sensors that are "read" by the software list all interrupt conditions list all "switches" that are actuated by the operator list all data conditions recalling the noun-verb parse that was applied to the software statement of scope, review all "control items" as possible CSPEC inputs/outputs describe the behavior of a system by identifying its states; identify how each state is reach and defines the transitions between states focus on possible omissions ... a very common error in specifying control, e.g., ask: "Is there any other way I can get to this state or exit from it?"

79
State Transition Diagram (STD)
")
80
Process Activation Table (PAT)
")
81
!!!!!!!!!!!!!!!!!!!!!!!!!!!!!!!!!!!!!!!!!!!!!!

82
Data Dictionary The data dictionary has been proposed as a quasi-formal grammar for describing the content of objects defined during structured analysis.

83
Data Dictionary Analysis modeling: structured analysis & object-oriented analysis Primary objectives: To describe what the customer requires To establish a basis for the creation of a software design To define a set of requirements that can be validated once the software is built.

84
The Data Dictionary CASE: structured analysis and Design tool

85
Information Name: the primary name of the composite data item Aliases:
other names for the data item Where used: data transforms (processes) that use the composite data item How used: the role of the data item (input, output, temporary storage, etc. Description: a notation for representing content (presented on next slide) Supplementary information: specific information about data types, pre-set values (if known) Although the format of dictionaries varies from tool to tool, most contain the following information.
 that use the. composite data item. How used: the role of the data item (input, output, temporary storage, etc. Description: a notation for representing content (presented. on next slide) Supplementary. information: specific information about data types, pre-set values (if known) Although the format of dictionaries varies from tool to tool, most contain the following information.")
86
Data Dictionary Notation

87
Example Build the requirements dictionary: Dial phone telephone number
Telephone number tones Build the requirements dictionary: Name: Telephone number Aliases: none Where/How Assess against set-up (output) used: Dial phone (input) Description: telephone no. = [ local number | long distance number ] local number = prefix + access number long distance number = 1+ area code +local number area code = [800 | 888 | 561] prefix = *a three digit number that never starts with 0 or 1* access number = *any four number string* Format: alphanumeric data
 used: Dial phone (input) Description: telephone no. = [ local number | long distance number ] local number = prefix + access number. long distance number = 1+ area code +local number. area code = [800 | 888 | 561] prefix = *a three digit number that never starts with 0 or 1* access number = *any four number string* Format: alphanumeric data.")
88
######### The End ###########

89
Data Modeling Data object description (DOD) Identify objects
Identify attributes Build data object table Entity relationship diagram (ERD) Identify entity relationship Identify cardinality & modality Build ERD Data object-type hierarchies, associative data objects…
 Identify entity relationship. Identify cardinality & modality. Build ERD. Data object-type hierarchies, associative data objects…")
90
Function Modeling Behavior Modeling Data Dictionary
Data Flow Diagram (DFD) Process Specification (PSPEC) Behavior Modeling Control Flow Diagram (CFD) Control Specification (CSPEC) State Transition Diagram (STD) Process Activation Table (PAT) Data Dictionary
 Process Specification (PSPEC) Behavior Modeling. Control Flow Diagram (CFD) Control Specification (CSPEC) State Transition Diagram (STD) Process Activation Table (PAT) Data Dictionary.")
91
#########End###########

92
Writing the Software Specification
Everyone knew exactly what had to be done until someone wrote it down!

93
Analysis Modeling: Where to Begin?
A statement of scope can be acquired from: the FAST working document A set of use-cases the statement of scope must be “parsed” to extract data, function and behavioral domain information

94
Specification Guidelines

95
Specification Guidelines

96
Specification Guidelines

97
Analysis Modeling What Why How Who Product
What best representation of the requirements combine the text and diagram Why find error, inconsistency, omissions How model data, functional, and behavioral requirements Product data object descriptions, entity relationship diagrams, data flow diagrams, state transition diagrams, process specifications, and control specifications

98
Statement of Scope a relatively brief description of the system to be built indicates data that are input and output and basic functionality indicates conditional processing (at a high level) implies certain constraints and limitations
 implies certain constraints and limitations.")
99
Flow Modeling Notes each bubble is refined until it does just one thing the expansion ratio decreases as the number of levels increase most systems require between 3 and 7 levels for an adequate flow model a single data flow item (arrow) may be expanded as levels increase (data dictionary provides information)
 may be expanded as levels increase (data dictionary provides information)")
Similar presentations


. Slides copyright 2009 by Roger Pressman.1.>")

>")


