Download presentation
Presentation is loading. Please wait.

1
Changes in Fine-Sediment Storage During the LSSF Matt Kaplinski, Joe Hazel, Mark Manone, Rod Parnell, Joe Cain, John Souter Northern Arizona University And Jack Schmidt, Hoda Sondossi, Utah State University

2
Data Collection Preliminary Results NAU USU Conclusions

6
NAU Sites (March, June, August, September) Topographic surveys of sand bars/channel margins Hydrographic surveys of the eddy and channel Grain size samples of the sand bar/eddy/channel Photographs
 Topographic surveys of sand bars/channel margins Hydrographic surveys of the eddy and channel Grain size samples of the sand bar/eddy/channel Photographs")
7
Reach-based approach (June, August, September) Reach 1: mile 1 to RM3 (Paria riffle to Cathedral Wash) Reach 2: mile 29 to mile 32 (Silver grotto to South Canyon eddy) Reach 3: mile 42 to mile 46 (above Anasazi Bridge to below Eminence camp) Reach 4: mile 60 to mile 61 (60 mile rapids to mouth of LCR) Reach 5: mile 63 to mile 66 (below Crash Canyon gravel bar to Lava-Chuar rapids)
 Reach 1: mile 1 to RM3 (Paria riffle to Cathedral Wash) Reach 2: mile 29 to mile 32 (Silver grotto to South Canyon eddy) Reach 3: mile 42 to mile 46 (above Anasazi Bridge to below Eminence camp) Reach 4: mile 60 to mile 61 (60 mile rapids to mouth of LCR) Reach 5: mile 63 to mile 66 (below Crash Canyon gravel bar to Lava-Chuar rapids)")
8
Reaches Topographic surveys of water line, offshore, selected sand bars Multibeam/singlebeam hydrographic surveys spatial referencing: underwater microscope, hydro shore station, sampling locations, vegetation transects placed photo panels for checking LiDAR accuracy

13
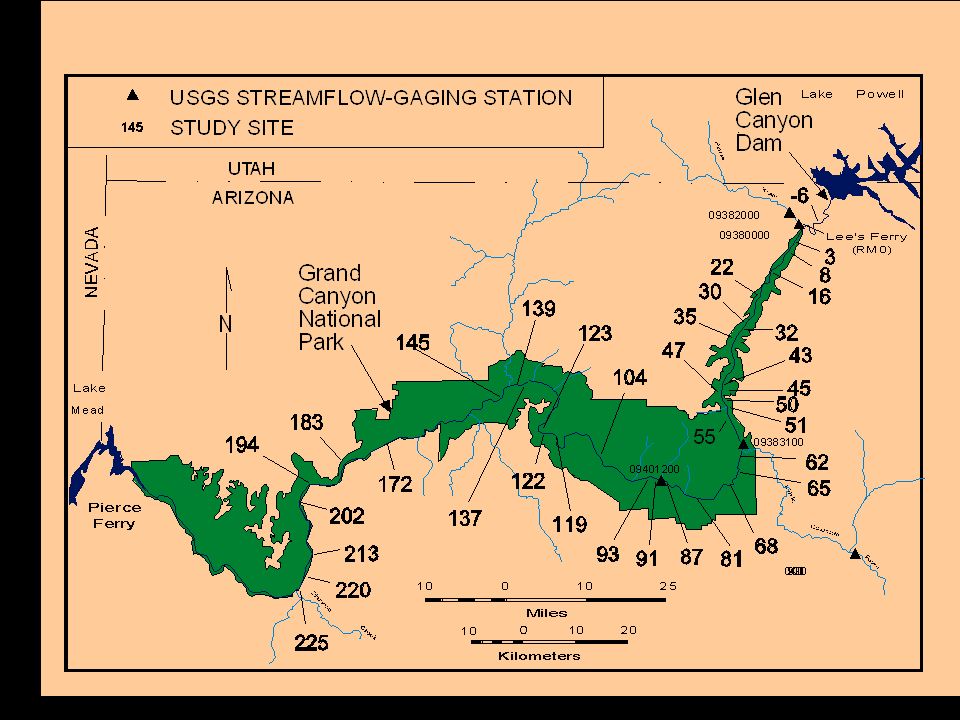
September 2000 Spike Flow: Analysis of Aerial Images (Utah State Univ.) Study area: Sixtymile Rapid to LCR (2 river km) Map area of exposed submerged, wet, dry sand before and after spike; map water’s edge at 31,500 cfs during spike Compare areas of sand and areas of backwaters before and after spike and in relation to conditions after 1996 flood
 Study area: Sixtymile Rapid to LCR (2 river km) Map area of exposed submerged, wet, dry sand before and after spike; map water’s edge at 31,500 cfs during spike Compare areas of sand and areas of backwaters before and after spike and in relation to conditions after 1996 flood")
14
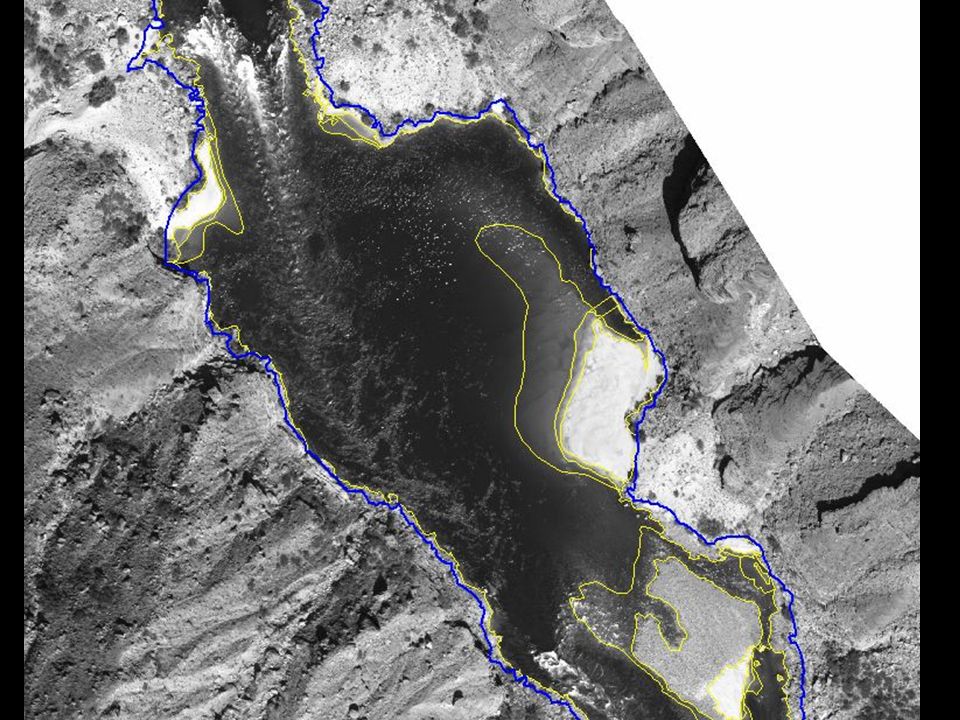
Outline of deposits immediately before the fall 2000 spike Water’s edge during the fall 2000 spike Outline of deposits 2 weeks after the fall 2000 spike Water’s edge during the fall 2000 spike BeforeAfter

15
Ratio of area of eddy inundated, to the total eddy area

16
Total area of backwater (m 2 )
")
17
Fill ratio Eddy Count:Gain: 8Loss: 5No Change: 3

18
Number of Eddies

19
Fill ratio

20
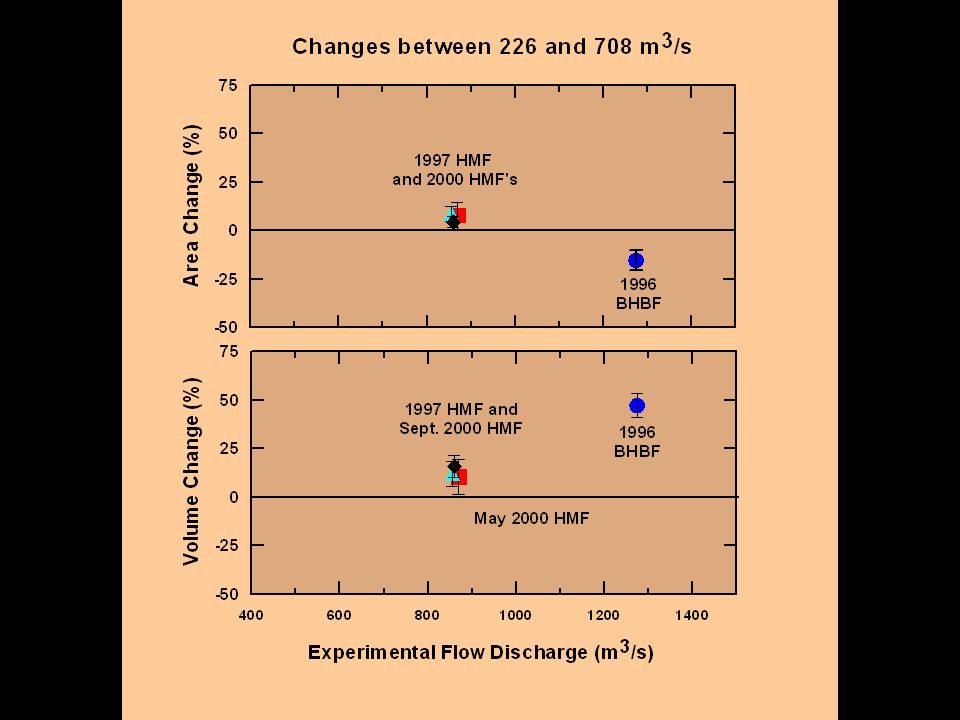
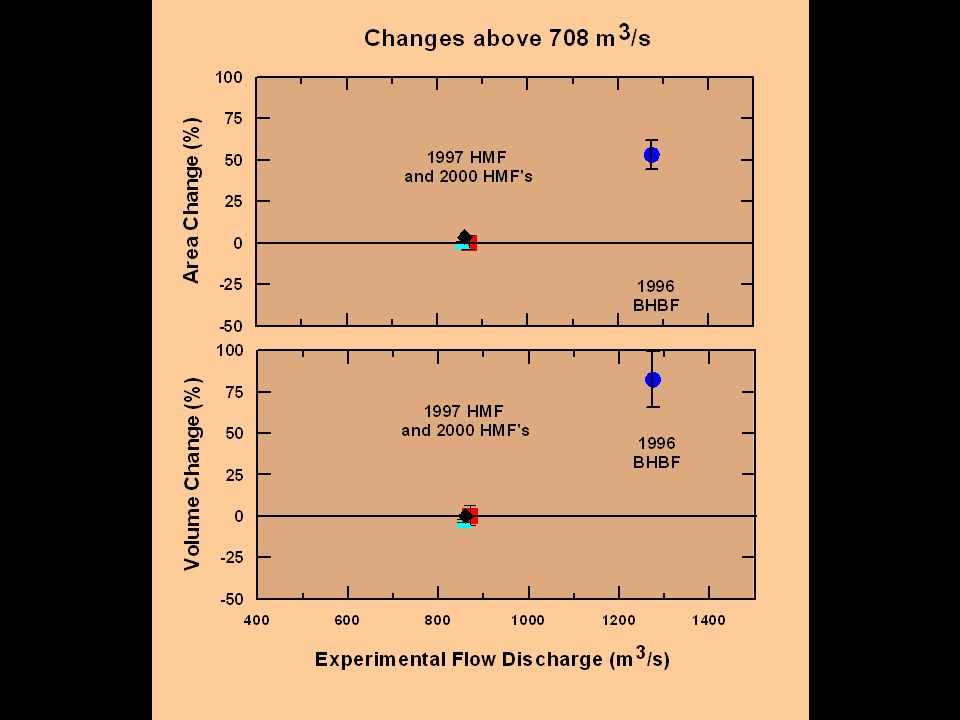
Preliminary Conclusions No significant change in the high-elevation (above 25,000 cfs ) parts of sand bars The mid-level (8,000 cfs to 25,000 cfs) parts of sand bars were aggraded during both the spring and fall high flow events No data yet available to assess topographic changes at low elevations within eddies or of the channel bed Topographic measurements made at 18 study sites between Lees Ferry and Phantom Ranch generally agree with aerial image analysis of changes at 15 eddies near the LCR Backwater area (at least from 60 to 61 mile) increased substantially during the Fall high flow power-plant capacity flows inundate approximately 23% less area within eddies than 45,000cfs
 parts of sand bars The mid-level (8,000 cfs to 25,000 cfs) parts of sand bars were aggraded during both the spring and fall high flow events No data yet available to assess topographic changes at low elevations within eddies or of the channel bed Topographic measurements made at 18 study sites between Lees Ferry and Phantom Ranch generally agree with aerial image analysis of changes at 15 eddies near the LCR Backwater area (at least from 60 to 61 mile) increased substantially during the Fall high flow power-plant capacity flows inundate approximately 23% less area within eddies than 45,000cfs")
Similar presentations


, F. Liébault (1), H.>")


