Download presentation
Presentation is loading. Please wait.

1
Cluster Analysis

2
Cluster Analysis: a method of summarizing data, similar to factor analysis cases are grouped into “clusters” with other similar cases it’s a way of “grouping” people into meaningful groups or clusters

3
There are two types of cluster analysis: R and Q type analysis:
R Type to what extent do the variables covary across the cases? Q Type to what extent do the cases covary across the variables? (the kind we will be doing) Q-type cluster analysis involves the development of a matrix, based on the number of cases. This matrix can get very large, particularly with large data sets.
 Q-type cluster analysis involves the development of a matrix, based on the number of cases. This matrix can get very large, particularly with large data sets.")
4
Suggestion: break the data set up into a smaller sub-set of data to run the analysis (many computers can’t handle the large matrices). Also, you can increase memory temporarily by opening a syntax window and using the following command: SET MXMEMORY = (generally, set the memory to double the RAM – if you have 16 mg, set it at 32000; if you have 32 mg, set it at 64000).
.")
5
The Basis for Cluster Analysis:
For a given set of variables, individuals can be described in terms of elevation (e.g., is a particular case high on all variables?), shape (do several cases have the same profiles across several variables), and scatter/dispersion (variation). Example:
, shape (do several cases have the same profiles across several variables), and scatter/dispersion (variation). Example:")
6
Hierarchical Cluster Analysis
Each “case” starts out as a separate cluster; at each step, cases that are closest together are merged into larger clusters.

7
Distance Measures Squared Euclidean Distance: the most common, recommended with centroid and Ward’s method of clustering. Euclidean Distance: based on the hypotenuse of a right triangle, connecting two points in two dimensional space

8
Clustering Methods There are several ways that SPSS will cluster cases: Nearest neighbor: (also referred to as single-linkage) – finds the two cases separated by the shortest distance, and places them in the first cluster; then the next shortest distance is found, and either a new cluster is formed (with another case), or it joins the first cluster; the advantage to this method is that it has desirable mathematical properties, but the drawback is that it tends to form chain-like, elongated clusters
 – finds the two cases separated by the shortest distance, and places them in the first cluster; then the next shortest distance is found, and either a new cluster is formed (with another case), or it joins the first cluster; the advantage to this method is that it has desirable mathematical properties, but the drawback is that it tends to form chain-like, elongated clusters.")
9
Furthest neighbor: (also referred to as complete linkage) – clustering is based on maximum distance. Any candidate for inclusion in a cluster must be similar to all members of that cluster. This is a more rigorous criterion than single-linkage, and it tends to produce compact clusters of highly similar cases

10
Centroid – the average or mean value of the cases in the groups is used to determine the clusters
Ward’s method: the sum of squares between two clusters is summed over all variables; clusters with the greatest similarity are combined at each stage

11
Example: A cluster analysis was run on a sub-sample of NELS data (N = 290). The variables measuring science achievement, self-concept, and locus of control were used to form the clusters. The furthest neighbor method and squared Euclidean distance measure were used in the analysis. Three and four cluster solutions were produced.
. The variables measuring science achievement, self-concept, and locus of control were used to form the clusters. The furthest neighbor method and squared Euclidean distance measure were used in the analysis. Three and four cluster solutions were produced.")
12
First, all missing data were removed, and all variables were converted to z scores (self concept and locus already are z-scored): Note: it is extremely important that all variables are on the same scale for cluster analysis – z scoring accomplishes this. set mxmemory = select if not missing (by2xsstd). select if not missing (bylocus1). select if not missing ( bycncpt1). descriptives variables = by2xsstd /save.
. select if not missing (bylocus1). select if not missing ( bycncpt1). descriptives variables = by2xsstd. /save.")
13
After the analysis was run, means on the clustering variables were examined for each group (using the MEANS program in SPSS), using each of the clustering variables as predictors: First, MEANS was run on the three group solution, using science achievement, self-concept, and locus of control as the dependent variables: We now can describe each group. Note the low N’s in groups 2 and 3.

14
Now, let’s look at the descriptives for the 4 group solution:
Groups 1 and 2 look okay, but groups 3 and 4 still have very low N’s.

15
The ANOVA table is below, but be wary of the low N’s in groups 3 and 4:

16
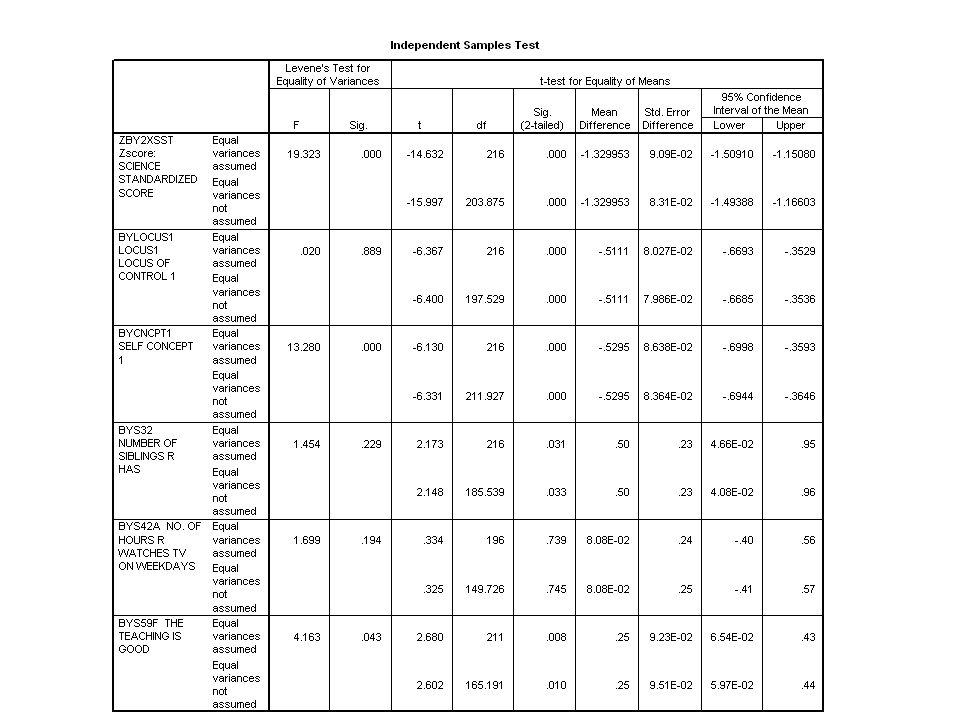
Now, let’s look at t-tests, comparing groups 1 and 2 on the clustering variables, and on several other variables as well:

18
Now, let’s run a chi square analysis, to examine gender and its relation to group membership:
First, I only want to include clusters 1 and 2 (because 3 and 4 have so few people in them), so I can use this statement in the syntax window to temporarily select these people: temporary. select if range (clu4_1, 1, 2). [the “temporary” statement will make this only last for the next analysis; you also can use “select cases” from the menu, but then you will have to de-select if you want to include the other clusters in subsequent analyses]
, so I can use this statement in the syntax window to temporarily select these people: temporary. select if range (clu4_1, 1, 2). [the temporary statement will make this only last for the next analysis; you also can use select cases from the menu, but then you will have to de-select if you want to include the other clusters in subsequent analyses]")
Similar presentations


:growth rate very slow, slow, medium, fast, very fast not ordered:fruit.>")

. The populations.>")


