Download presentation
Presentation is loading. Please wait.

1
RNA Processing Data Analysis Lisa Bloomer Green April 26, 2010

2
RNA Processing Data Analysis ● Real Time PCR ● Splicing ● The Problem ● Solving the Simplified Problem ● Making it Complicated Again

3
Real-time PCR DNA is copied again and again for exponential growth in quantity present. http://pathmicro.med.sc.edu/pcr/realtime-home.htm Cycle Number Amount of DNA 2416777216 2533554432 2667108864 27134217728 28268435456 29536870912 301073741824 311400000000 321500000000 331550000000 341580000000 Cycle Number Amount of DNA 01 12 24 38 416 532 664 7128 8256 9512 101024

4
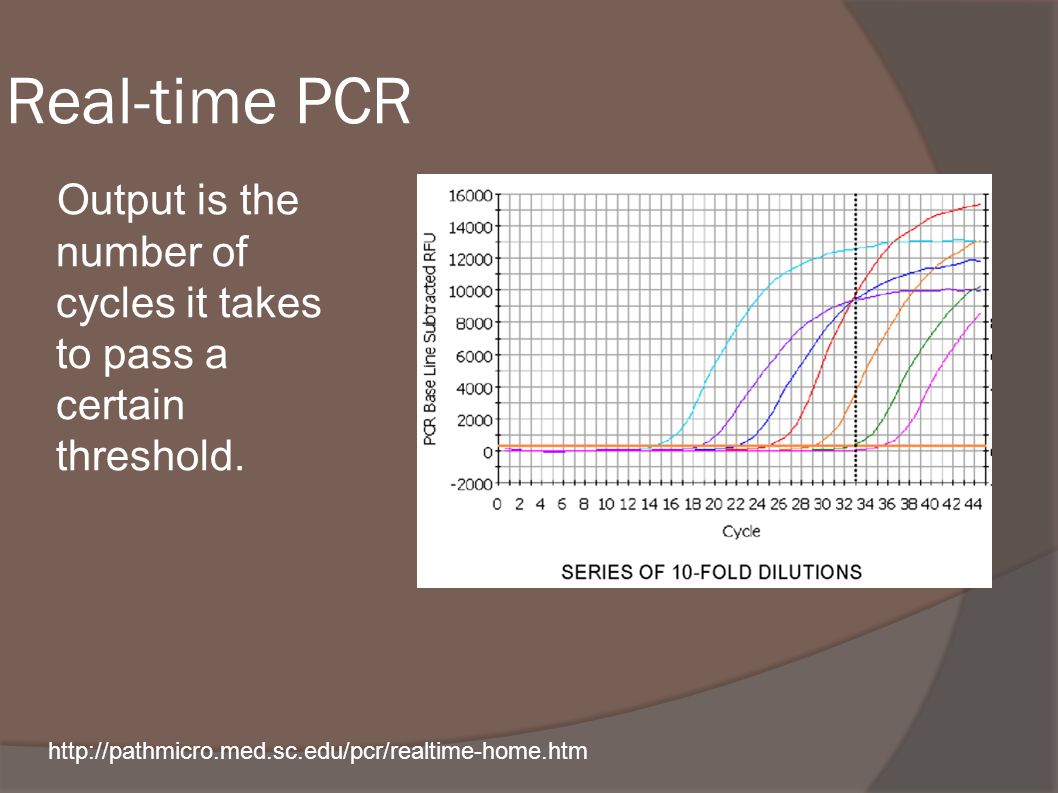
Real-time PCR Output is the number of cycles it takes to pass a certain threshold. http://pathmicro.med.sc.edu/pcr/realtime-home.htm
5
The Problem Use real-time PCR to help discover how often alternative splicing occurs in a given region of RNA. Alternative Splicing: A mechanism by which different forms of mature mRNAs (messengers RNAs) are generated from the same gene. http://www.medterms.com/script/main/art.asp?articlekey=1683 1
 are generated from the same gene. articlekey=")
6
rpoBrpoC1rpoC2 rpoBrpoC1rpoC2 rpoBrpoC1 rpoC2 Rpo chloroplast operon mRNA

7
Preliminary Data rpoBrpoC1rpoC2 rpoBIR1rrpoC1IR2rrpoc2 19.8426.8822.5223.7715.71

8
psbIpsbK psbIpsbK psb chloroplast operon mRNA

9
psbIpsbK Preliminary Data psbIIRppsbK 14.8620.0214.94

10
A Simplified Version Model the curve using an exponential function.

11
A Simplified Version Because we use the same threshold for each quantity, we will assume that N t is the same for each quantity.

12
Example psbLIRppsbK Cycle Count14.8620.0214.94 Initial Count (is proportional to) 3.36 * 10 -5 9.41 * 10 -7 3.18 * 10 -5 psbLIRppsbK Cycle Count14.8620.0214.94 Initial Count (is proportional to) 3.36 * 10 -5 9.41 * 10 -7 3.18 * 10 -5 Percentage50.7%1.4%47.9%
 3.36 * * * psbLIRppsbK Cycle Count Initial Count (is proportional to) 3.36 * * * Percentage50.7%1.4%47.9%")
13
Example rpoBIR1rrpoC1IR2rrpoC2 Cycle Count 19.8426.8822.5223.7715.71 Initial Count 1.07 * 10 -6 8.10 * 10 -9 1.66 * 10 -7 6.99 * 10 -8 1.87 * 10 -5 Percentage5.34%0.04%0.83%0.35%93.44%

14
Adding Complexity ● Need to estimate variability for N 0 ● The process may not be 100% efficient. We probably get less than double the amount with each cycle. ● The shape of the curve shows behavior that does not fit the exponential model. ● N t might be different for the different quantities.

15
Variability Estimation Standard deviation of Ct is estimated between 0.036 cycles and 0.367 cycles, with an average of 0.183 cycles. (Rutledge and Cote) psbLIRppsbK Cycle Count14.8620.0214.94 Confidence Interval (using 0.183 for st.dev.) (14.50, 15.22)(19.66, 20.38)(14.58, 15.30)
 psbLIRppsbK Cycle Count Confidence Interval (using for st.dev.) (14.50, 15.22)(19.66, 20.38)(14.58, 15.30).")
16
Variability Estimation To get confidence intervals for the percentages, we need to know how these cycle numbers interact. psbLIRppsbK Cycle Count Confidence Interval (14.50, 15.22)(19.66, 20.38)(14.58, 15.30) 2 -Ct Confidence Interval (2.6*10 -5, 4.3*10 -5 )(7.3*10 -7, 1.2*10 -6 )(2.5*10 -5, 4.1*10 -5 )
(19.66, 20.38)(14.58, 15.30) 2 -Ct Confidence Interval (2.6*10 -5, 4.3*10 -5 )(7.3*10 -7, 1.2*10 -6 )(2.5*10 -5, 4.1*10 -5 ).")
17
Efficiency E is a number between 0 and 1 that quantifies the efficiency of the doubling process. E can be estimated from the standard curve. ● Fit a line to the log curve. ● Es=e^(-slope)+1 Estimates of E range from 0.85 to 1. (Fronhoffs. et. al.)
+1 Estimates of E range from 0.85 to 1. (Fronhoffs. et. al.).")
18
Example psbLIRppsbK Cycle Count14.8620.0214.94 Initial Count E=1 3.36 * 10 -5 9.41 * 10 -7 3.18 * 10 -5 E=0.95 4.90 * 10 -5 1.56 * 10 -6 4.64 * 10 -5 E=0.90 7.21 * 10 -5 2.63 * 10 -6 6.85 * 10 -5 E=0.85 1.07 * 10 -4 4.48 * 10 -6 1.02 * 10 -4 psbLIRppsbK Cycle Count14.8620.0214.94 Percentage E=1 50.7%1.4%47.9% E=0.95 50.5%1.6%47.9% E=0.90 50.3%1.8%47.8% E=0.85 50.2%2.1%47.7%

19
Efficiency Can we assume that the efficiency is the same for each quantity? How does efficiency affect variability? (There is evidence that efficiency and threshold cycle are dependent.)
.")
20
The Curve is Not Exponential Logistic growth? Does this change the percentages?

21
Is N t the same for the different quantities? Probably not. The flourescence measured is affected by mass as well as number. Are the masses known? If not, can we assume that the masses are similar?

22
Summary A simplified version of the problem has a straight-forward solution, which may be enough for general purposes. Reinserting the complexity into the problem leads to interesting statistical issues.

23
References ● Fronhoffs, et. al. “A method for the rapid construction of cRNA standard curves in quantitative real-time reverse transcription polymerase chain reaction,” Molecular and Cellular Probes (2002) 16, 99-110. ● Rutledge and C ô t é “Mathematics of quantitative kinetic PCR and the application of standard curves,” Nucleic Acids Research (2003) 31, no. 16. ● Swillens, et. al. “Instant evaluation of the absolute initial nuber of cDNA copies from a single real-time PCR curve,” Nucleic Acids Research (2004) 32, no. 6.
 16, ● Rutledge and C ô t é Mathematics of quantitative kinetic PCR and the application of standard curves, Nucleic Acids Research (2003) 31, no. 16. ● Swillens, et. al. Instant evaluation of the absolute initial nuber of cDNA copies from a single real-time PCR curve, Nucleic Acids Research (2004) 32, no. 6..")
Similar presentations


 MCB7300.>")


? If a certain gene is on when the cell divides, the gene.>")


, one can amplify the DNA enough to detect it by electrophoresis.>")


>")
 rapidly>")
