Download presentation
Presentation is loading. Please wait.

1
Lesson 2A

2
Bell work You and your friends have decided to go to Mexico. There are miles of beautiful beaches, you will be able to explore a new culture, you will see plenty of wildlife, and you will get to practice your Spanish. But what will you do once you are there? The library, the bookstore and the Internet all feature a wealth of resources, but there are too many options to browse them all. You do not want to get guidebooks that are not helpful, or read information that is not useful to you. What techniques can you use to find the information you need?

3
Strategy Instruction Find the Data (notes at end) The 3-Step Method for Data Representation Step 1: Highlight keywords Step 2: Use the diagrams Step 3: Answer the questions (*cannot use highlighter on ACT test)
 The 3-Step Method for Data Representation Step 1: Highlight keywords Step 2: Use the diagrams Step 3: Answer the questions (*cannot use highlighter on ACT test)")
4
FYI: Keywords Tell You What You Know All questions have two sets of keywords. If you can locate both sets, you can often answer the question without even reading the passage above the diagram.

5
Notes: Highlighting Keywords What do you know? Underline the keywords that tell you what you know What do you need? Circle the keywords that tell you what you need to find out.

6
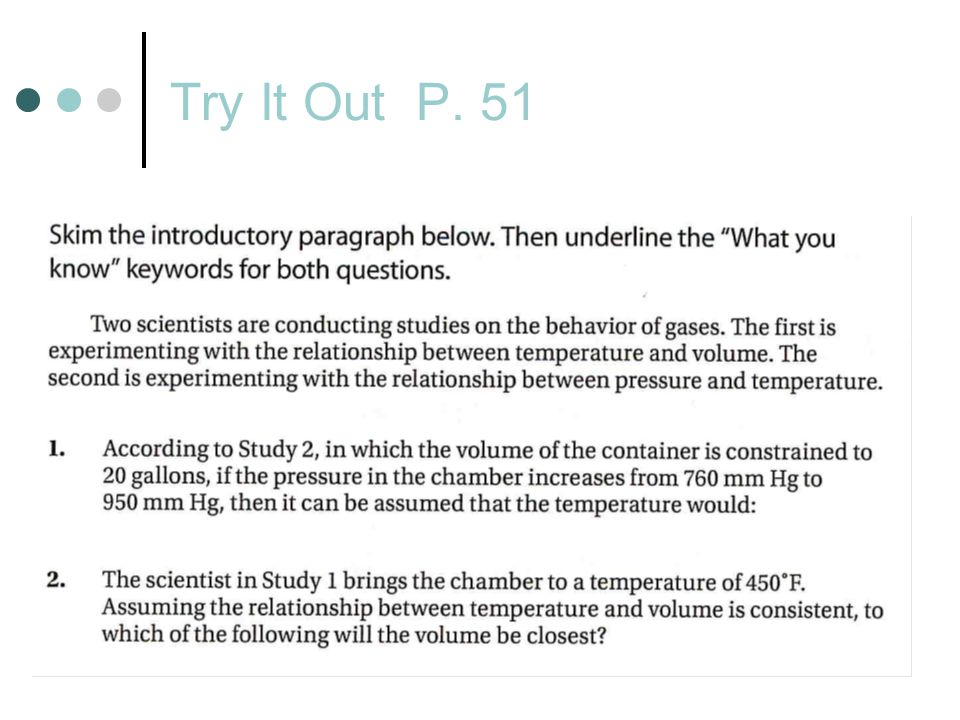
Notes: What Do You Know? Keywords tell you three things the name of the diagram the data point or trend that is known the title of the column or axis for the unknown data point or trend Try It Out P. 51

8
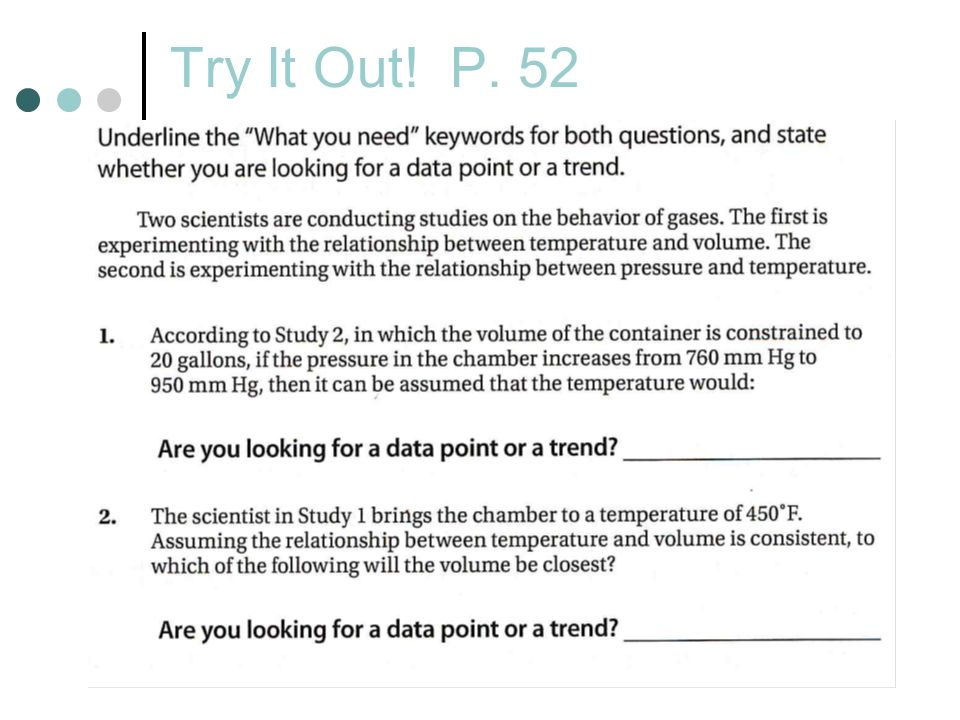
Keywords Tell You What You Need Keywords tell you two things the label of a specific column, row or axis in which the information can be found if the information you need is a data point or a trend Try It Out! P. 52

10
Keyword Clues Work in a group to define Directly Proportional Inversely Proportional Ratio Consistent Most Likely Expect Respectively

11
Notes if needed: Keyword Clues Directly Proportional: describes two trends that both increase or decrease together Inversely Proportional: describes two trends in which one increases while the other decreases Ratio: compares one data point to another 3:2 females to males Consistent: implies that a trend follows the same pattern shown in the figure

12
Keyword Clues Most Likely: indicates that you will be predicting a value beyond the range of the graph Expect: sometimes indicates that you will be predicting a value beyond the range of the graph Respectively: indicates that items are listed in the order they are described

13
Try It Out! P. 53

14
Notes: The 3-Step Method for Data Representation Step 1: Highlight keywords Read the introduction to determine the general focus of the passage Read the question and highlight the keywords Step 2: Use the diagrams Use the keywords to select the correct heading from the current diagram Find the data point or summarize the trends If the information is not in the table, read the text above the table Step 3: Answer the questions Match the information from the diagram to one of the answer choices Check that the text you have underlined and your analysis of the diagram support your answer

15
Work with a partner Possible Formative Assignment Guided Practice Shared Practice

16
Class Discussion KAP Wrap Highlighting keywords to take the ACT isn't like highlighting text for other purposes. Explain how you can decide which words are ACT keywords, and which are not.

17
Lesson 2B Tables and Figures After two weeks of reading travel guides, browsing the internet, and talking to people, you and your friends know a lot more about places to go in Mexico. You have decided to make two stops on your journey. First, you will visit the Lacondon Rainforest, one of the most diverse ecosystems in the world. Then, you will scuba dive around Cozumel Island for a few days while you visit your friend's relatives and get a taste of Mexican culture.

18
Bell Work The journey from the rainforest to Cozumel is about 500 miles - about the distance from Chicago to Memphis. You do some research into transportation methods, but you still must make a choice.

19
Transportation Cost Time Plane $400 2 hours Train $200 6 hours Bus $100 10 hours What is the relationship between cost and time? Which method of transportation would you choose?

20
Remember Strategy Instruction Find the Data The 3-Step Method for Data Representation Step 1: Highlight keywords Step 2: Use the diagrams Step 3: Answer the questions

21
Notes: Data Formats on the ACT Line Graphs Line graphs show change over time, or change on a continuous scale. Tables Tables may show sequential or non- sequential data. The ACT often will not list data in increasing or decreasing order.

22
FYI When approaching tables and figures on the ACT, begin with the keywords from a question. First, find the table or figure, then find the column, row, or axis that matches the "What you know" keywords. Find the data point or trend that matches the "What you know" keywords, and put your finger or pencil point on it. Then find the column, row or axis that matches the "What you need" keywords. Finally, use "What you know" and "What you need" to find the point or trend that answers the question.

23
Class Discussion Unfamiliar Data Formats on the ACT List graphs - then identify the information you can get.

24
Scatter Plots: show each data point separately. Sometimes trends are found in clusters, or they may approximate lines. Vertical Line Graphs: just a rotation of Line Graphs Shaded Tables: some tables show regions that are shaded or blank instead of showing numbers. Try It Out! P.67

25
Working with Multiple Axes Line graphs may have units labeled on two y-axes or two x-axes. For these figures, it is necessary to use the key to determine which trend to look at. Then use the axes to determine which scale to use.

26
Tables with Multiple Sets of Data Tables may also mix many types of information. Try It Out! P.68

27
Reminder: The 3-Step Method for Data Representation Step 1: Highlight keywords Read the introduction to determine the general focus of the passage Read the question and highlight the keywords Step 2: Use the diagrams Use the keywords to select the correct heading from the current diagram Find the data point or summarize the trends If the information is not in the table, read the text above the table Step 3: Answer the questions Match the information from the diagram to one of the answer choices Check that the text you have underlined and your analysis of the diagram support your answer

28
Work with a partner Possible Formative Assignment Guided Practice Shared Practice

29
KAP Wrap Individual in Notebook – will be graded The first two steps of the 2-Step Method for Data Representation are written below. After each step, write one piece of advice you would give to someone trying to use the method for the first time.

30
Step 1: Highlight keywords Read the introduction to determine the general focus of the passage Advice:_________________________________________ Read the question and highlight the keywords Advice:________________________________________ Step 2: Use the diagrams Use the keywords to select the correct heading from the current diagram Advice:________________________________________ Find the data point or summarize the trends Advice:________________________________________ If the information is not in the table, read the text above the table. Advice:________________________________________

31
Class Discussion ReKap Lesson 2A and 2B 1. When looking for keywords, first find the ones that tell you "What you ___," such as axes, _____ and _____. Then look for "What you ____" keywords, which tell you where to find the information and if it is a ____ or a ____. 2. When approaching a new passage, you should always read the ____, but you do not need to read the rest unless it is necessary to answer a question. 3. If the "What you know" keywords contain a data point, and the "What you need" keywords do not state what you are looking for, you can assume that ______. 4. List two thing that you should NOT underline when looking for "What you know" or "What you need" keywords.

32
Lesson 2C Using Patterns

33
Strategy Instruction Making Predictions Some ACT questions will ask you to predict data based upon a trend. This may involve extending the trend beyond the highest or lowest data point available or predict a new data point between two other points. If there are no lines in the area of the graph for which you are predicting data, use the edge of a sheet of paper to draw a straight line to connect the points and extend them beyond the edges of the graph. Try It Out! P.80

34
Examining New Data Some questions may ask you to compare a new data point to the data in a figure or table. To answer these questions, first draw the new data point on the existing figure. Then use the keywords to make comparisons. Try It Out! P.81

35
Test Practice Unit 2 Work Individually 16 questions 15 minutes Formative Show evidence of strategies Highlight, underline keywords Draw on graphs and tables, circle headings, labels

36
Test Practice Unit 2 Answers 1 D 9 B 2 J 10 H 3 A 11 C 4 F 12 F 5 D 13 B 6 H 14 G 7 B 15 D 8 J 16 F

37
KAP Wrap

Similar presentations