Download presentation
Presentation is loading. Please wait.

1
Exploring Patents & Citations Using GIS 2008Indiana GIS Conference Indiana Geographic Information Council Exploring Patents & Citations Using GIS 2008 Indiana GIS Conference Indiana Geographic Information Council Presented by Indraneel Kumar, AICP Eda Unal Purdue Center for Regional Development Purdue University

2
WhyStudy Patents & Citations? Why Study Patents & Citations? Patents are considered “output indicators” of innovation Patents are considered “output indicators” of innovation Inventors are part of human capital Inventors are part of human capital Citations are used to study “knowledge flows”; spillovers; feedback effects Citations are used to study “knowledge flows”; spillovers; feedback effects Knowledge-based assets Knowledge-based assets Innovation & inventors are essential for the knowledge economy Innovation & inventors are essential for the knowledge economy

3
Outline National trends National trends Indiana trends Indiana trends Citations database Citations database Next steps Next steps Acknowledgements Acknowledgements

7
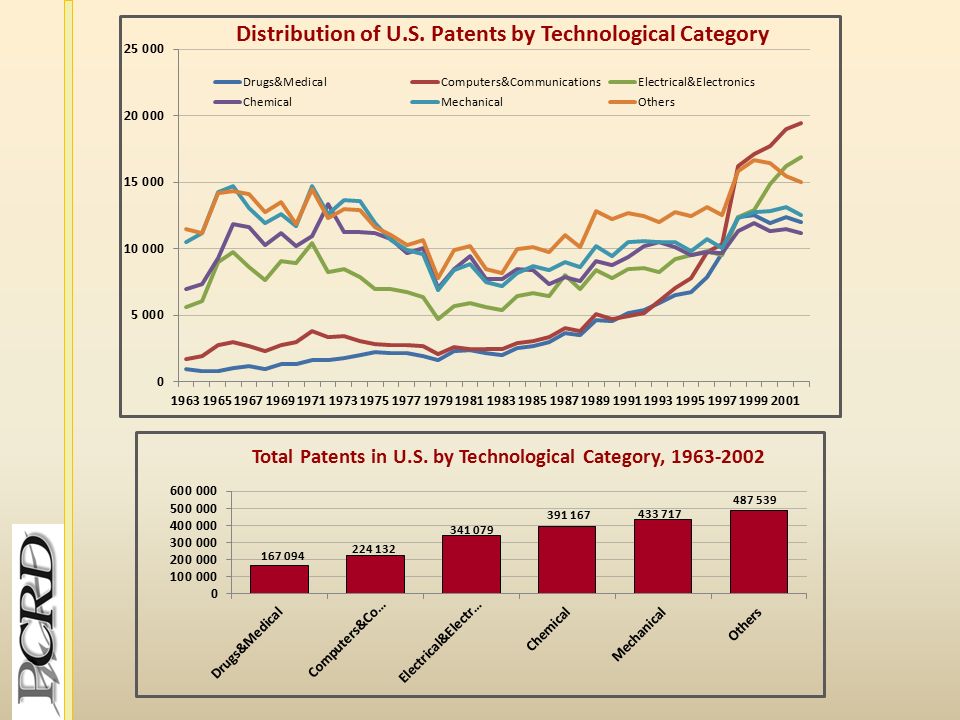
Top Ten Patents From U.S.

8
Patents 1991-1994

9
Patents 1995-1998

10
Patents 1999-2002

11
Patents, 2002 Percentile Distribution Patents, 2000 Percentile Distribution Exploratory Spatial Data Analysis Percentile distribution of number of patents by states does not change significantly year-by-year From 2000-2002, Illinois lost, Michigan gained From 1996-2000, distribution remained almost identical

12
Exploratory Spatial Data Analysis Patents per 100,000 population, 2000 Patents per 100,000 population, 2002 Percentile distribution of number of patents per 100,000 population by states shows a different pattern Idaho is leading followed by Minnesota, Vermont, & Massachusetts during 2000-2002

13
Exploratory Spatial Data Analysis Patents per 100,000 Employment, 2000 Patents per 100,000 Employment, 2002 Percentile distribution of number of patents per 100,000 employment similar to population Idaho, Minnesota, Vermont, Massachusetts, & California

14
Exploratory Spatial Data Analysis Scatter plots between patents, total employment, professional and technical services, and health care and social assistance employment BEA, data suppression issues

15
Exploratory Spatial Data Analysis Does a state with high/low patent counts affect its neighbors? Spatial clustering exists or not? Do other economic variables affect patents or not? Spatial autocorrelation improves after removing the outliers

16
Exploratory Spatial Data Analysis Patents vs. Spatial Lag variables of Total Employment and Professional and Technical Employment in 2002 Excluding a few outliers, the direction of slope does change

17
Patents From Indiana From Year 1963-2002; 43,485 Utility Patents were granted First Inventor’s home address is Indiana At a state level, home and work place address usually is the same Exception is the counties at the “Edge” neighboring major metropolitan areas (Northeast Indiana & Chicago; Dearborn County & Cincinnati) At a metropolitan level, home and work place address might match
 At a metropolitan level, home and work place address might match")
18
At a county level, home and work place address might not match Inter-county commuting is prevalent in Indiana, particularly within metropolitan areas Selection of spatial scale is important !!! Exploratory Spatial Data Analysis (ESDA) reveals that a sub-state geography might be a useful scale for study Patents From Indiana
 reveals that a sub-state geography might be a useful scale for study Patents From Indiana.")
20
Top Ten Patents From Indiana by Class

21
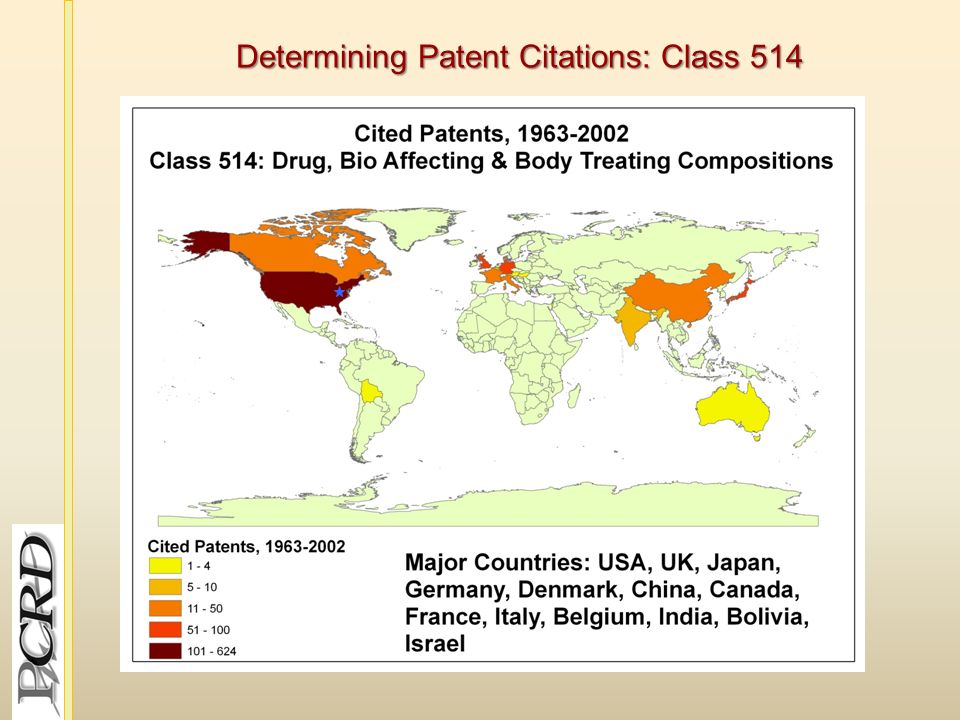
Determining Patent Citations: Class 514 Class 514 Indiana Patents in 2002 102 Patents Cited 917 Patents 25 Different States including Indiana 30% Cited Patents are from other countries Citing-Cited Database (22 million records) Patents Database (3.4 million records)
 Patents Database (3.4 million records)")
22
Determining Patent Citations: Class 514

24
Determining Inventors in progress….

25
Determining Inventors in progress….

26
Next Steps Tests of significance County level mapping by different patent classes County level distribution of inventors Relationships to regional growth, if any!

27
Acknowledgement In this presentation, the data was taken from “The NBER Patent Citations Data File: Lessons, Insights and Methodological Tools” by Brownyn H. Hall, Adam B. Jaffe, and Manuel Trajtenberg; University of California at Berkeley Florida International University Spatial Analysis Laboratory, GeoDa, UIUC ET GeoWizards; Hawths Tools ESRI ArcGIS Spatial Statistics Toolbox

28
Thank You!! Indraneel Kumar- ikumar@purdue.eduikumar@purdue.edu Eda Unal- unale@purdue.eduunale@purdue.edu

Similar presentations


 Dr.Ruiz (University.>")


>")


