Download presentation
Presentation is loading. Please wait.

1
DATA MANAGEMENT MBF3C Lesson #4: Measures of Central Tendency

2
Learning Goals: To identify and describe properties associated with normal, bimodal & skewed distributions To calculate, using formulas, measures of central tendency (i.e., mean, median, mode). To calculate, using a graphing calculator, measures of central tendency (i.e., mean, median, mode). To explain the appropriate use of measures of central tendency (i.e., mean, median, mode)
. To explain the appropriate use of measures of central tendency (i.e., mean, median, mode).")
3
INTRODUCTION In the last three sections, you explored methods of collecting and displaying data. In the next three sections, you will calculate statistics that can be used to analyse a set of data. Measures of central tendency provide information on the centre of a set of data.

11
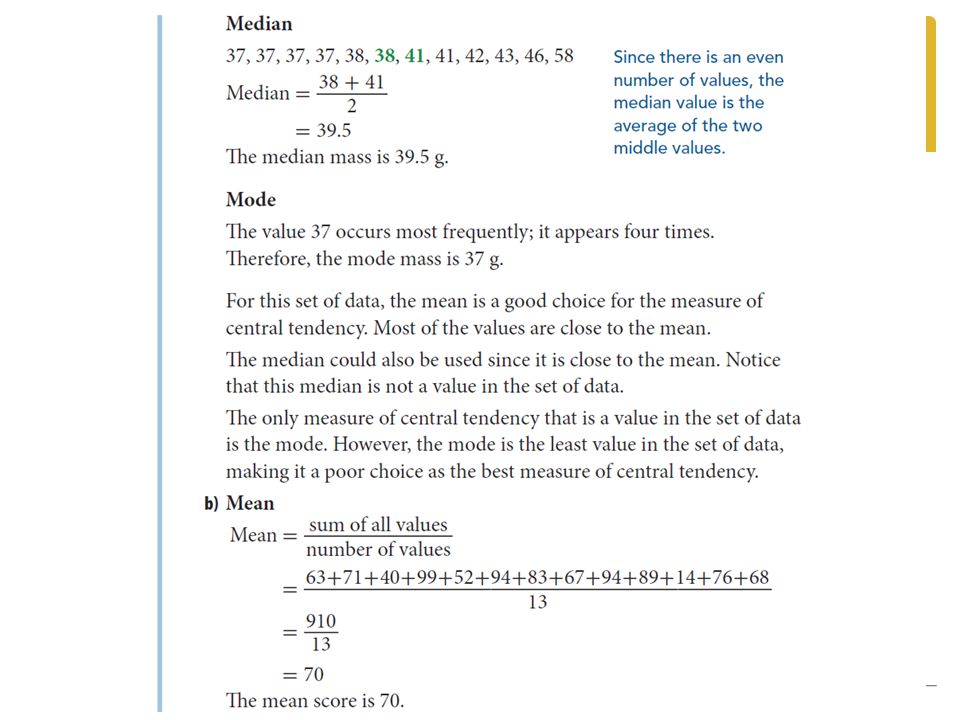
Key Concepts The mean, the median, and the mode are measures of central tendency of a set of data. The mean is calculated by adding the data and dividing the total by the number of data values. The median is found by listing the data in order from least to greatest and finding the middle value. If there is an even number of values, the median is the mean of the two middle values. The mode is found by finding the most frequently occurring value. A set of data can have more than one mode or no mode.

12
SUMMARY:

Similar presentations


>")


