Download presentation
Presentation is loading. Please wait.

1
Iowa Farmland Realtors Land Institute December 6, 2004 Michael Duffy

2
Outline I. Background II. Land Values i. Rate of Return ii. Expectations III. Land Ownership Trends and Implications IV. Land Rents and Rental Arrangements V. Costs of Production VI. Are we set up for another fall?

4
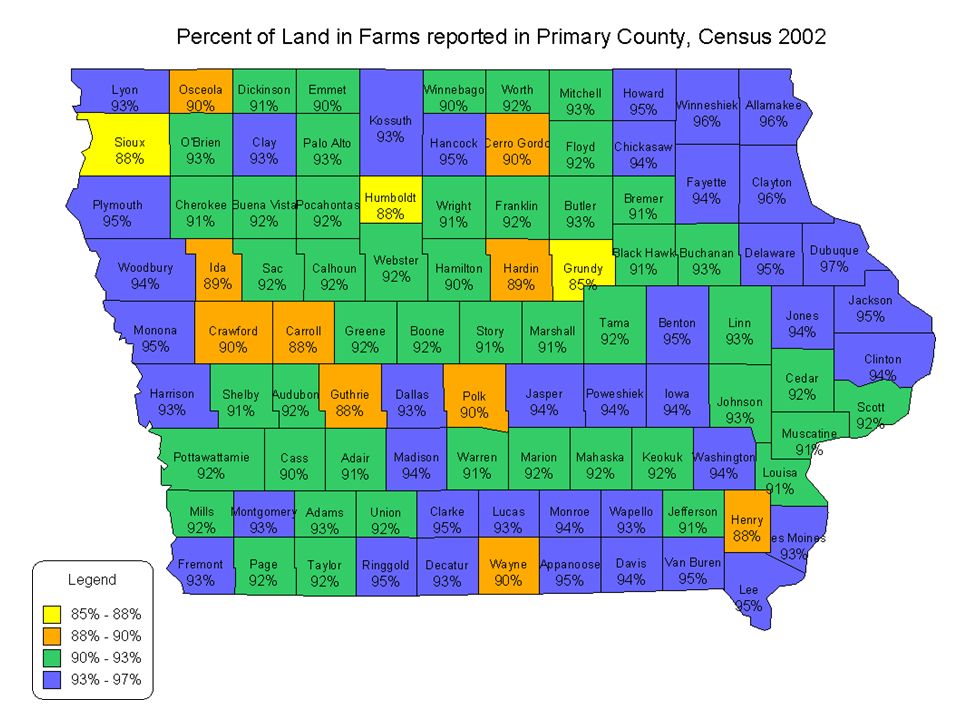
Iowa Farmland 68 percent of land is harvested 62 percent of the land is in corn or soybeans 68 percent of the land in farms is in corn or soybeans Iowa farmland valued at approximately $73B 91 percent of land is in farms

6
Percent of Farmland* in Corn, Soybeans *Does not include land in building sites or woodlands.

7
Percent of Farmland* Idled, in Cover Crops, Unharvested, Failed, or Abandoned *Does not include land in building sites or woodlands.

8
Percent of Farmland* in Hay and Oats *Does not include land in building sites or woodlands.

9
Percent of Farmland* in Pasture** * Does not include land in building sites or woodlands. **Includes both woodland and rangeland pasture.

10
Percent of Farmland in Woodlands, Houses, Ponds, Roads, and Wasteland Wright Worth Woodbury Winneshiek Winnebago Webster Wayne Washington Warren Wapello Van Buren Union Taylor Tama Story Sioux Shelby Scott Sac Ringgold Poweshiek Pottawattamie Polk PocahontasPlymouth Palo Alto Page Osceola OBrien Muscatine MontgomeryMonroe Monona Mitchell Mills Marshall MarionMahaskaMadison Lyon Lucas Louisa Linn Lee Kossuth Keokuk Jones Johnson Jefferson Jasper Jackson Iowa Ida Humboldt Howard Henry Harrison Hardin Hancock Hamilton Guthrie Grundy Greene Fremont Franklin Floyd Fayette Emmet Dubuque Dickinson Des Moines Delaware Decatur Davis Dallas Crawford Clinton Clayton Clay Clarke Chickasaw Cherokee Cerro Gordo Cedar Cass Carroll Calhoun ButlerBuena Vista Buchanan Bremer Boone Black Hawk Benton Audubon Appanoose Allamakee Adams Adair 4.4% 5.1% 7.3% 14.4% 5.6% 5.9% 10.9% 11.0%13.8% 16.2% 20.7% 11.0% 11.5% 7.0% 5.6% 4.6% 5.0% 5.5% 6.0% 12.1% 9.1% 6.7% 6.8% 4.4%5.2% 4.3% 9.6% 4.1% 4.8% 10.9% 7.6%19.1% 9.1% 6.2% 8.8% 6.3% 12.4%10.2%14.5% 5.4% 21.0% 12.3% 11.0% 18.2% 4.1% 11.9% 11.3% 10.0% 16.8% 7.6% 18.5% 12.4% 5.8% 5.3% 8.6% 15.2% 8.6% 5.4% 3.5% 4.9% 9.5% 3.7% 6.2% 9.1% 5.3% 6.0% 10.0% 3.8% 15.2% 3.9% 12.0% 10.0% 16.0% 16.3% 7.7% 7.0% 7.5% 22.0% 5.1% 14.6% 7.3% 5.7% 4.2% 8.3% 6.0% 6.3% 4.4% 7.0% 5.2% 6.2% 7.3% 8.5% 6.5% 6.8% 7.2% 16.6% 30.2% 9.1% 8.6% 3.5% - 6.0% 6.0% - 10.0% 10.0% - 15.0% 15.0% - 31.0%

20
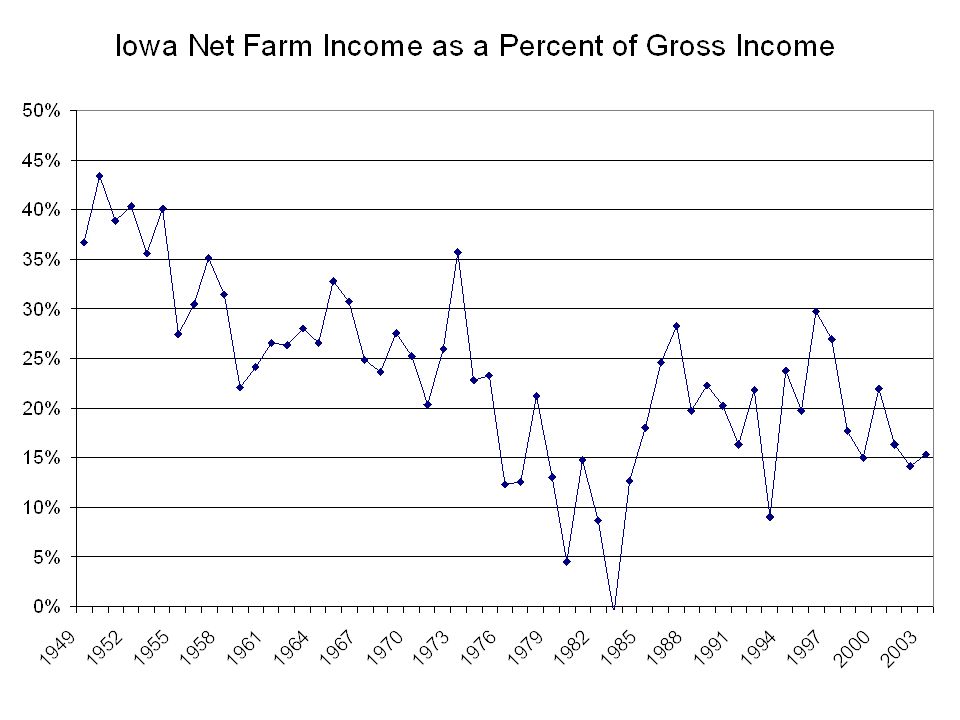
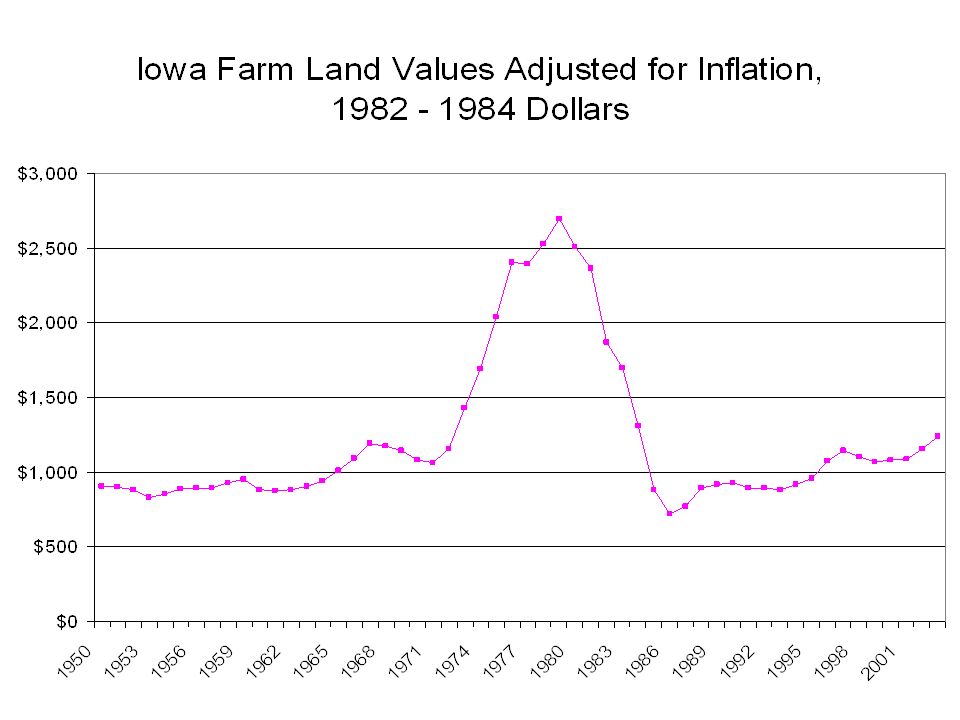
Rate of Return

21
Capitalization Rate 2002 land taxes $10 land management fee ISU Extension Estimated Costs of Production, Land Values, and Cash Rents Government payment data from Environmental Working Group

27
Land Compared to Dow Jones Yearly Dow Jones Industrial dividend reported by Dow Jones USDA/Economic Research Service rent values ISU Extension land values Assume $1,000 invested with returns reinvested Land tax is only ownership cost assumed

35
Land Expectations ISU survey released Dec. 14, 2004 Federal Reserve estimation; 2% increase 3 rd Quarter; 12% increase July to July USDA/ERS estimate; $2,200 per acre; 9.5% increase Jan. to Jan. Chapter estimate; 14.4% increase September to September

42
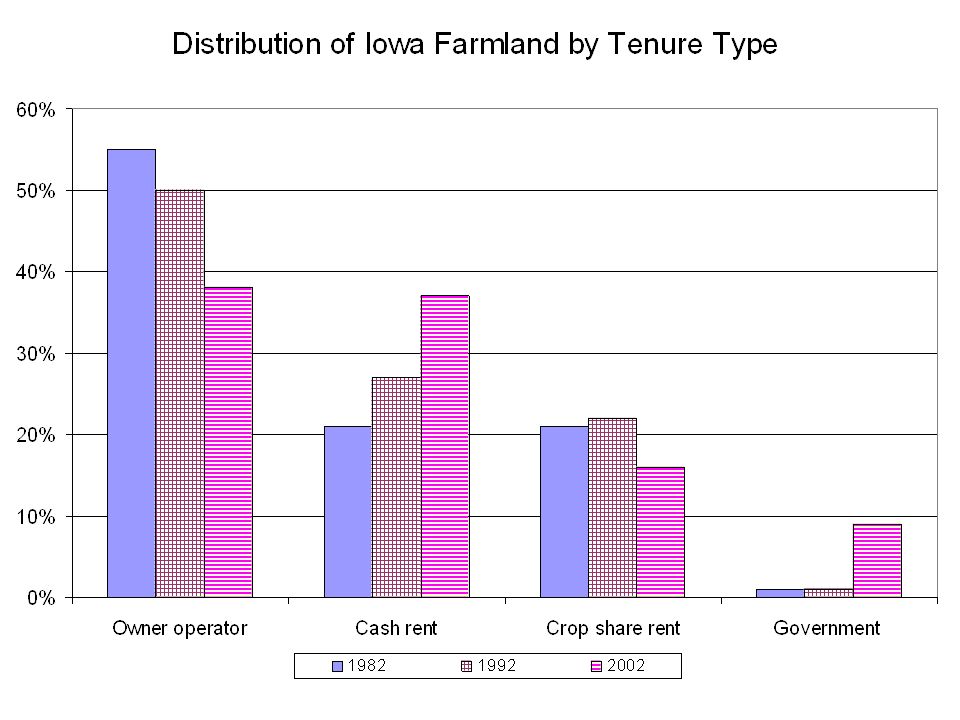
Land Ownership Trends Telephone survey conducted by ISU Statistical Laboratory Data as of July 1, 2002 633 useable responses, 80% response

49
Land Rents and Rental Arrangements

58
Costs of Production

73
Are we setting ourselves up for a fall?

77
Conclusions Iowa farmland owners are aging and the trend will continue for the next several years There will be a considerable amount of Iowa’s farmland change hands over the next few years. More than likely this land will be passed on to the next generation and not even enter the market. There will continue to be an increase in the amount of land owned by people outside the state.

78
Conclusions Land ownership patterns will change with fewer sole owners and more multiple owners More land will be rented and cash rents will increase in prevalence Second generation may have different views towards land

79
Conclusions Less debt against the land Different category of purchasers Fewer contracts Factors to watch Government programs Interest rates Exchange rates Deficit

Similar presentations


 957-5790>")


