Download presentation
Presentation is loading. Please wait.

1
No GSEG? Low Budget Data Initiative with High Dollar Impact Lisa Backer 619 Co-Coordinator/ECSE Specialist MN Department of Education lisa.backer@state.mn.us

2
The Context A bit about Minnesota….

3
Minnesota is the birthplace of…. Water-skiing SPAM Bob Dylan Judy Garland Target Stores Prince

4
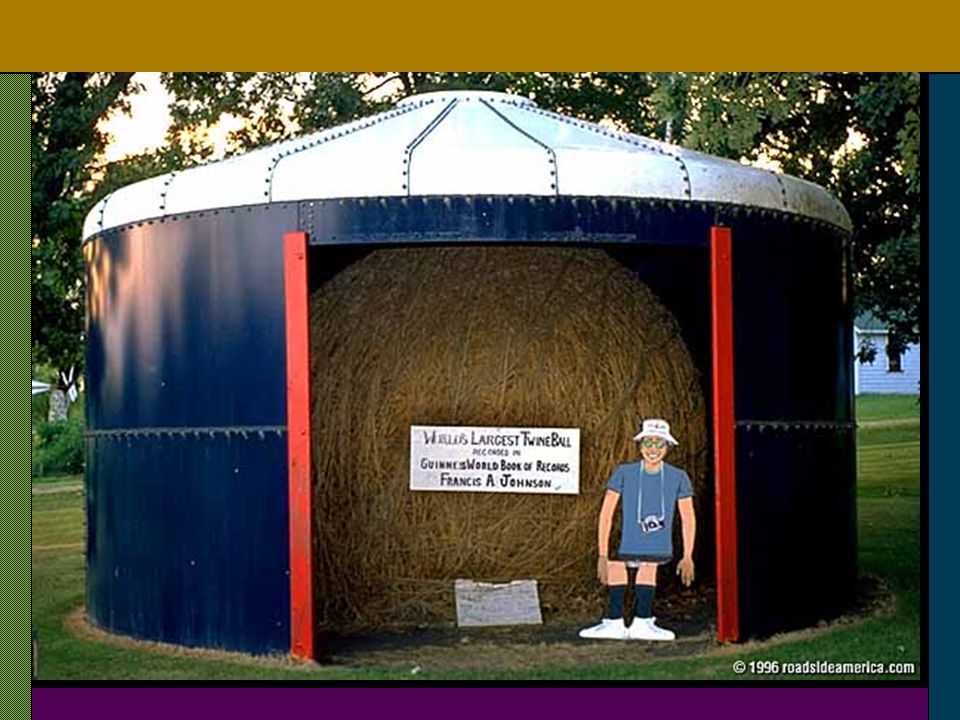
We are home to… The Mall of America The first professional wrestler to hold the office of Governor The headwaters of the Mississippi River The world’s largest ball of twine Yes, I that says “twine”

6
MN Is “Birth Mandate” State Education is the lead agency for Part C Interagency agreements with MN Depts. Of Health and Human services Free, Appropriate Public Education provided to young children from birth Local efforts driven by Interagency Early Intervention Committees (IEIC’s)
.")
7
MN’s Continuous Improvement Process 2000: Completion of Self Assessment & Identification of 12 Priority Areas 2001: Planning year for Areas 1-5 2002: Implementation of Areas 1-5 Planning year for Areas 6-8 2003: Implementation for Areas 1-8 Planning year for Areas 9-12

8
Identified Priority Areas Workforce Diversity Child Find Mental Health Service Coordination Educational Results Inclusion Assistive Technology Transitions Accountability and Compliance Family Involvement Geographic Disparities

9
Continuous Improvement Monitoring Process: Self Review (MnCIMP:SR) Alternative to traditional compliance monitoring 80% of all districts participate Uses baseline data and tracks improvement in key areas –Graduation/dropout rates –Suspension/expulsion –Standardized test scores & Alternate Assessments –Least Restrictive Environments
 Alternative to traditional compliance monitoring 80% of all districts participate Uses baseline data and tracks improvement in key areas –Graduation/dropout rates –Suspension/expulsion –Standardized test scores & Alternate Assessments –Least Restrictive Environments")
10
MnCIMP: SR Process Planning Phase –Initial program evaluation –Compliance self-review –Planning report submitted to MDE Implementation –Data analysis –Impact of initiated improvement strategies –Report submitted to MDE

11
MnCIMP: SR Process Verification Visit by MDE monitor and trained “peer” monitors Report of visit generated by MDE and provided to district leadership and staff Children served through Part C and 619 were planfully included in verification visit activities.

12
Questions Posed by OSEP Is Minnesota identifying all eligible infants Birth to Age 1? Do the identified infants & toddlers reflect the demographics of the local area ? How effective are primary referral sources ?

13
And More Questions….. Do primary referral sources differ by age (<1, 2, 3) ? Are IEICs and their member agencies effectively identifying young children and their families? Is there variability from one part of the state to another?

14
And Finally…. The APR Minnesota’s data SNAFU –Age on December 1 rather than September 1 OSEP Verification Visit

16
QBQ: The Questions Behind the Question Who’s to blame? Why are we so disorganized/dysfunctional? Why won’t our administration fiscally support a better data system? What can I do?

17
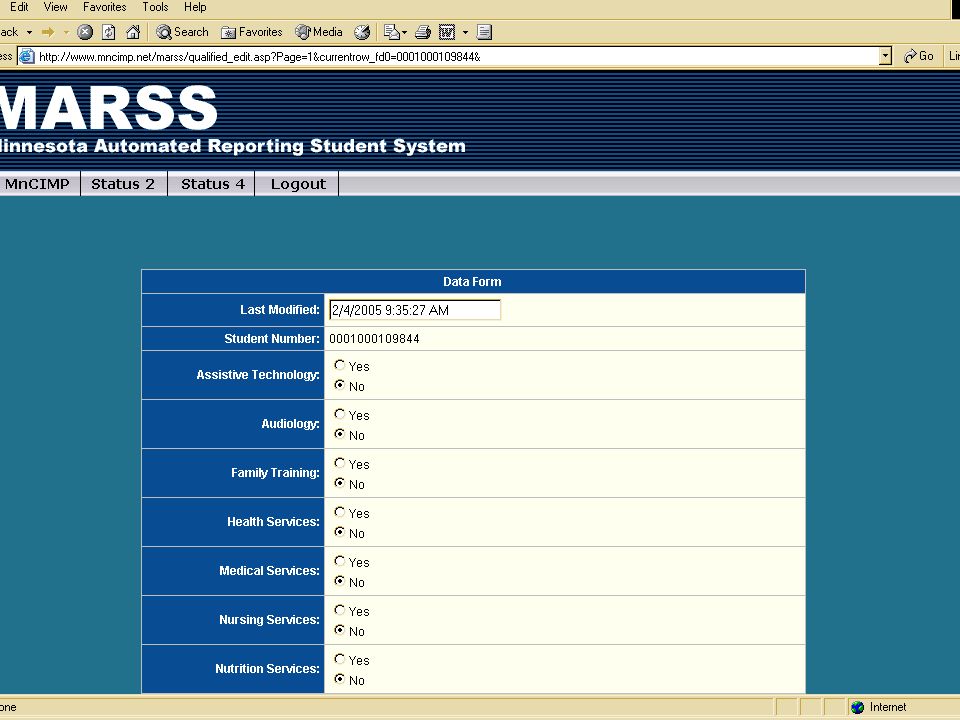
MN’s Existing Data System MARSS System –Minnesota Automated Reporting Student System Unique identifier assigned at time of enrollment –Initial evaluation –Determination of eligibility

18
Key Data Elements in MARSS District Race/Ethnicity Instructional Settings Gender Economic Indicator Mobility Indicator Home Primary Language Primary Disability Status End Codes Hours of Service (membership)
")
19
“Missing” Data Elements Services by individual child Child and Family Outcomes Primary and Secondary Referral Sources

20
Part C Enhanced Data Collection Added to existing “rogue” website Set-up cost absorbed by existing State Improvement Grant Data analysis done by staff from Department of Education Mandatory participation by districts

26
Indicators

29
Areas of Quality Child Find/Determining Eligibility Functional Child Goals or Outcomes Instructional Settings/Inclusion Comprehensiveness & Intensity of Service Routines-based, Transdisciplinary Intervention Measuring Child Progress Family Outcome Measures

30
ECSE Quality Indicators Child Find/Determining Eligibility Instructional Settings/Inclusion Comprehensiveness & Intensity of Service Measuring Child Progress Family Outcome Measures

31
Child Find Indicators Percent of general population <1 Percent of general population 0 through 2 Percent of general population 0 through 4 Proportion of identified children from a racial/ethnic group compared to the racial/ethnic makeup of the general population

32
Additional Child Find Indicators Use of a variety of disability criteria Proportion of kindergarten enrollment initially determined eligible and the primary disabilities of those children. Proportion of referrals made by specific primary and secondary sources

33
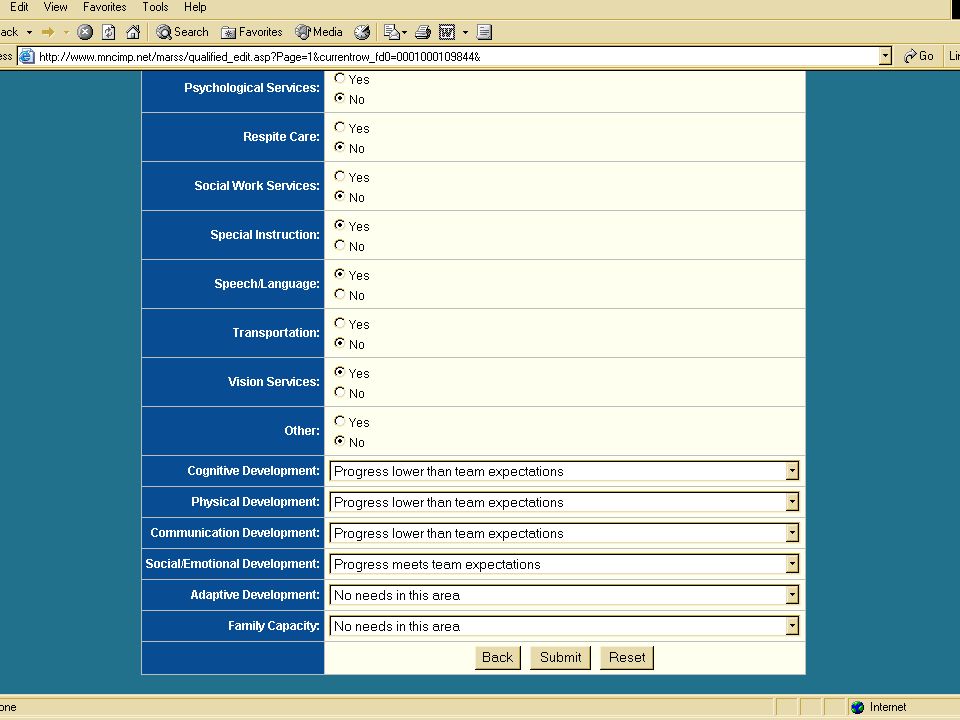
Child Progress What percent of children served under age 3 demonstrates improved and sustained functional abilities? –Cognitive development; –physical development, including vision and hearing; –communication development; –social or emotional development; and –adaptive development.

34
Child Outcomes Young children with disabilities entering kindergarten demonstrate increased levels of proficiency in the areas –Physical well-being and motor development –Social and Emotional Development –Approaches to learning –Language Development –Cognition –Creativity and the Arts

35
Comprehensiveness & Intensity Local areas comprehensively identify needs and provide a full array of early intervention services. A range of intensity is evident within each district’s ECSE program –By age? –By Primary Disability?

36
Natural Environments/LRE Proportion of infants/toddlers served in natural environments –At home –In programs designed for children without disabilities Proportion of children age 3 through 5 served in Early Childhood Settings or at Home

37
Family Participation Supports, services and resources provided to each family increase the family’s capacity to enhance the development of their child.

38
November, 2004 Sometimes the Plants and Stars Align…..

39
Putting Data to Work Easy access Ease of use Meaningful comparisons –State –Region –Strata –To the individual district as trends over time Accuracy

40
2003-2004 ECSE District Profile Based on Excel 2000 Utilized “Lookup” functions Displayed data on those indicators for which accurate data was available Annually updateable Will “live” on MDE website on the Continuous Improvement landing page

41
District Profile In Action

Similar presentations


 Preparing for the State Systemic Improvement Plan.>")
>")


>")


