Download presentation
Presentation is loading. Please wait.

2
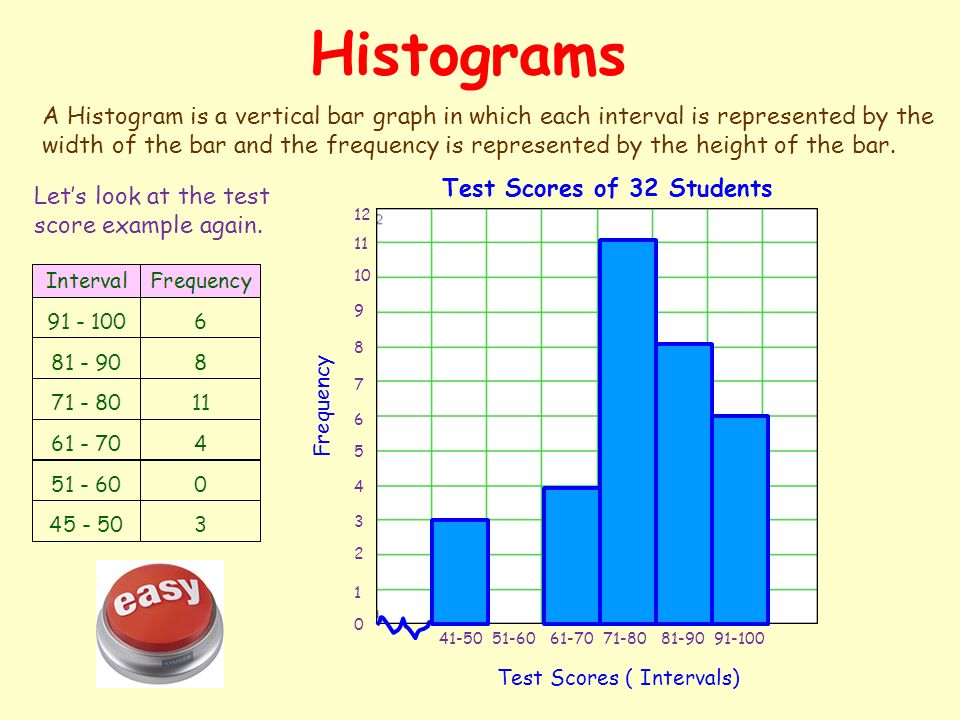
Histograms A Histogram is a vertical bar graph in which each interval is represented by the width of the bar and the frequency is represented by the height of the bar. Let’s look at the test score example again. Test Scores of 32 Students Test Scores ( Intervals) Frequency 41-50 51-60 61-70 71-80 81-90 91-100 12 11 10 9 8 7 6 5 4 3 2 1 0
 Frequency")
3
Another Histogram The following table represents the number of miles per gallon obtained by 40 drivers. Miles per Gallon for 40 Drivers Mileage (Miles per Gallon) Frequency 16-19 20-23 24-27 28-31 32-35 36-39 40-43 12 11 10 9 8 7 6 5 4 3 2 1 0
 Frequency")
4
Cumulative Histogram The following table represents test scores of 240 students in a school. Test Scores Frequency 51-60 61-70 71-80 81-90 91-100 75 70 65 60 55 50 45 40 35 30 25 20 15 10 5 0 Now let’s make a Cumulative Frequency Table. Cumulative Histogram Test Scores 51-60 61-70 71-80 81-90 91-100 Frequency 240 220 200 180 160 140 120 100 80 60 40 20 0

5
More Cumulative Histograms The following table represents the number of book students bring home. Cumulative Number of Books Brought Home Number of Books 0 1 2 3 4 5 6 7 Frequency 25 20 15 10 5 0

6
More Cumulative Histograms The following table represents the number of book students bring home. Cumulative Number of Books Brought Home Number of Books 0 1 2 3 4 5 6 7 Frequency 30 25 20 15 10 5 0

7
Homework Page 735: 10 – 13 Make a frequency histogram Page 736: 18 – 20 Make a cumulative frequency histogram

Similar presentations

 Graphs (line, bar,>")


