Download presentation
Presentation is loading. Please wait.

1
Chapter 2: Describing Location In a Distribution Section 2.1 Measures of Relative Standing And Density Curves

2
Case Study Read page 113 in your textbook

3
Where are we headed? Analyzed a set of observations graphically and numerically Consider individual observations

4
Consider this data set: 6767 72334 75777899 800123334 8569 903 How good is this score relative to the others?

5
Measuring Relative Standing: z-scores Standardizing: converting scores from the original values to standard deviation units

6
Measuring Relative Standing: z-scores A z-score tells us how many standard deviations away from the mean the original observation falls, and in which direction.

7
Practice: Let’s Do p. 118 #1

8
Measuring Relative Standing: Percentiles Norman got a 72 on the test. Only 2 of the 25 test scores in the class are at or below his. His percentile is 2/25 = 0.08, or 8%. So he scores in the 8 th percentile. 6767 72334 75777899 800123334 8569 903

9
Density Curves Histogram of the scores of all 947 seventh-grade students in Gary, Indiana. The histogram is: Symmetric Both tails fall off smoothly from a single center peak There are no large gaps There are no obvious outliers Mathematical Model For the Distribution

10
Density Curves

11
Density Curves: Normal Curve This curve is an example of a NORMAL CURVE. More to come later….

12
Describing Density Curves Our measure of center and spread apply to density curves as well as to actual sets of observations.

13
Proportions in a Density Curve

14
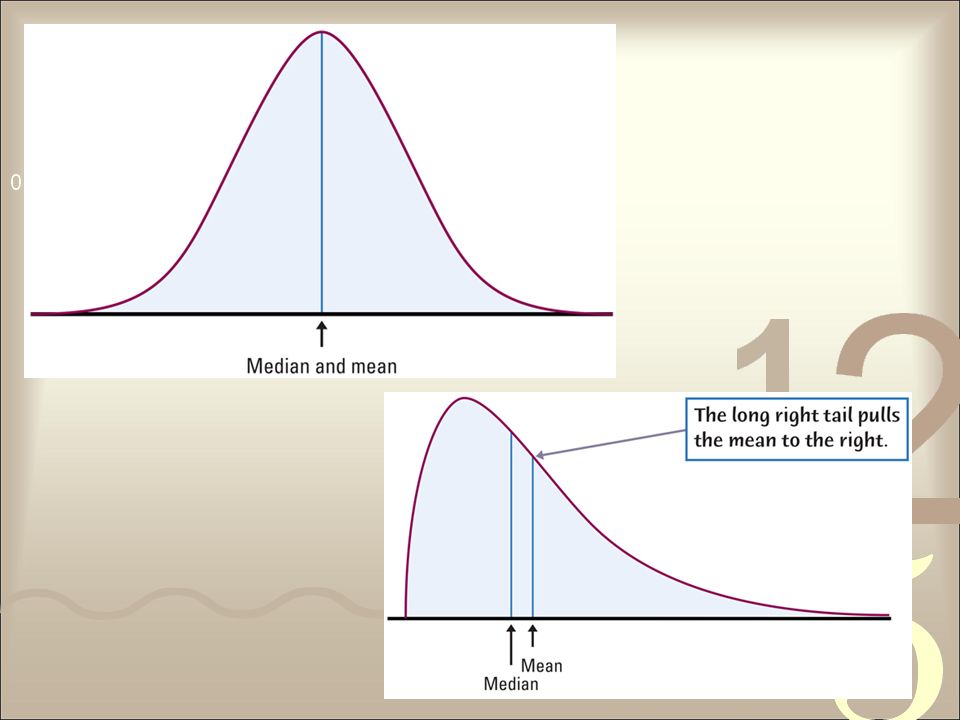
Describing Density Curves MEDIAN OF A DENSITY CURVE: –The “equal-areas point” –The point with half the area under the curve to its left and the remaining half of the area to its right

16
Describing Density Curves MEAN OF A DENSITY CURVE: –The “balance point” –The point at which the curve would balance if made of solid material

17
Mean of a Density Curve

18
Notation Use English letters for statistics –Measures on a data set –x = mean –s = standard deviation Use Greek letters for parameters –Measures on an idealized distribution –µ = mean –σ = standard deviation Usually

Similar presentations
. So far, we have used histograms to represent the overall shape of a distribution. Now smooth curves can be used:>")


