Download presentation
Presentation is loading. Please wait.

1
GEBA Project Summary Dongying Wu

2
Phylogenetic Tree Building (Martin Wu) Concatenate alignments of 31 marker genes build a PHYML tree 667 non-GEBA genomes, 53 genomes
 Concatenate alignments of 31 marker genes build a PHYML tree 667 non-GEBA genomes, 53 genomes")
3
Phylogenetic Distance (PD) PD=sum of all the branch lengths PD{A,B,C}=a+b+c+d A B a b C c d
 PD=sum of all the branch lengths PD{A,B,C}=a+b+c+d A B a b C c d")
4
Phylogenetic Distance Contribution of GEBA genomes 53 random non-GEBA taxa (from a pool of 667) contribute 3.15 to the tree PD (standard deviation:0.68 for 100 sampling) The total tree PD is 88.8, GEBA add 11.0 to the tree. The 26 GEBA actinobacteria add 4.29 to the total PD (actinobacteria as a whole add 8.128 PD) 26 random non-GEBA actinobacteria (from a pool of 47) contribute 1.37 PD (standard deviation 0.28, 100 sampling)
 26 random non-GEBA actinobacteria (from a pool of 47) contribute 1.37 PD (standard deviation 0.28, 100 sampling).")
5
227,562 genes from 56 genomes => 17,176,180 links Blastp: E value cutoff 1e-10, report 10000 hits Only blastp hits that span 80% of the lengths of both genes are kept as links Gene Family Classification

6
Links (matrix of sequence identities) Expansion Inflation (I=2) MCL Clustering Algorithm equilibrium state
 Expansion Inflation (I=2) MCL Clustering Algorithm equilibrium state")
7
50 - 100 20 - 50 10 - 20 5 - 10 1 - 5 20/56 - 1 10/56 - 20/56 2/56 - 5/56 5/56 - 10/56 1/56 46689 10601 2755 1588 1305 511 27 6 3 1 01000020000300004000050000 Number of Families F a m i l y S i z e ( g e n e s / g e n o m e )
")
8
Evenness estimation genomeGene distribution ratio for family X A0.316 B0.105 C0.026 D0 E0.184 F0.215 G0.158 Median 0.184 0.132 0.079 0.158 0.184 0 0.031 dist: Distance averrage =0.087 Evenness=100 x e -4 x dist 0.031

9
Universality: ratio of genomes that a family appears in Evenness: even distribution of gene family members across genomes Size: number of members in a gene family

10
Family size

11
Large families: famID size functions F2669 4210 (75/genome)ABC-type transport system ATP-binding protein F2670 1542 (27/genome)multi-sensor hybrid histidine kinase F2671 1367 (24/genome)short chain dehydrogenase F2672 1157 (20/genome)acyl-CoA synthetase F2673 782 (14/genome)serine/threonine protein kinase F2674 755 (13/genome)two-component system response regulator (LuxR family) F2675 735 (13/genome)two-component system response regulator (winged helix family) F2676 614 (11/genome)drug resistance transporter F2677 606 (11/genome)transcriptional regulator, LacI family F2678 568 (10/genome)two-component system sensor sensor histidine kinase F2679 543 (10/genome)sugar ABC transporter, permease component
ABC-type transport system ATP-binding protein F (27/genome)multi-sensor hybrid histidine kinase F (24/genome)short chain dehydrogenase F (20/genome)acyl-CoA synthetase F (14/genome)serine/threonine protein kinase F (13/genome)two-component system response regulator (LuxR family) F (13/genome)two-component system response regulator (winged helix family) F (11/genome)drug resistance transporter F (11/genome)transcriptional regulator, LacI family F (10/genome)two-component system sensor sensor histidine kinase F (10/genome)sugar ABC transporter, permease component")
12
Low universality large families: famID size organismfamily functiontaxonomy number F2682 461 7outer membrane proteinBacteroidetes; Proteobacteria F2699 303 6outer membrane protein Bacteroidetes F2736 180 6anti-sigma factor Bacteroidetes; Proteobacteria F2760 153 6transcriptional regulator, AraC family Bacteroidetes; proteobacteria F2772 147 5 RNA polymerase ECF-type sigma factor Bacteroidetes (Sphingobacteriales) F2801 129 11DNA-binding proteinActinobacteria(Actinobacteridae) F2827 114 3FtsX transmembrane transport protein Bacteroidetes (Sphingobacteriales) F2867 103 3hypothetical protein Actinobacteria;(Coriobacteriaceae)
 F DNA-binding proteinActinobacteria(Actinobacteridae) F FtsX transmembrane transport protein Bacteroidetes (Sphingobacteriales) F hypothetical protein Actinobacteria;(Coriobacteriaceae)")
13
3 out of 9 largest families have very low evenness value ( < 5) short chain dehydrogenaseacyl-CoA synthetase two-component system response regulator (LuxR) 0 1 0 2 0 3 0 4 0 5 0 6 0 7 0 8 0 0 1 0 2 0 3 0 4 0 6 0 0 2 0 4 0 6 0 8 0 1 0 0 1 2 0 0 1 0 2 0 3 0 4 0 5 0 6 0 0 1 0 2 0 3 0 4 0 5 0 6 0 7 0 8 0 9 0 1 0 0 0 1 0 2 0 3 0 4 0 50 60 56HalobacteriaHalorhabdus_utahensis 55HalobacteriaHalomicrobium_mukohataei 54HalobacteriaHalogeometricum_borinquense 53AminanaerobiaThermanaerovibrio_acidaminovorans 52DeferribacteresDethiosulfovibrio_peptidovorans 51DeinococciMeiothermus_silvanus 50DeinococciMeiothermus_ruber 49ChloroflexiThermobaculum_terrenum 48ChloroflexiSphaerobacter_thermophilus 47ActinobacteriaConexibacter_woesei 46ActinobacteriaAtopobium_parvulum 45ActinobacteriaSlackia_heliotrinireducens 44ActinobacteriaEggerthella_lenta 43ActinobacteriaCryptobacterium_curtum 42ActinobacteriaAcidimicrobium_ferrooxidans 41ActinobacteriaKribbella_flavida 40ActinobacteriaCatenulispora_acidiphila 39ActinobacteriaStackebrandtia_nassauensis 38ActinobacteriaGeodermatophilus_obscurus 37ActinobacteriaNakamurella_multipartita 36ActinobacteriaActinosynnema_mirum 35ActinobacteriaSaccharomonospora_viridis 34ActinobacteriaTsukamurella_paurometabola 33ActinobacteriaGordonia_bronchialis 32ActinobacteriaStreptosporangium_roseum 31ActinobacteriaThermobispora_bispora 30ActinobacteriaThermomonospora_curvata 29ActinobacteriaNocardiopsis_dassonvillei 28ActinobacteriaKytococcus_sedentarius 27ActinobacteriaBrachybacterium_faecium 26ActinobacteriaBeutenbergia_cavernae 25ActinobacteriaCellulomonas_flavigena 24ActinobacteriaXylanimonas_cellulosilytica 23ActinobacteriaJonesia_denitrificans 22ActinobacteriaSanguibacter_keddieii 21FirmicutesAnaerococcus_prevotii 20FirmicutesAlicyclobacillus_acidocaldarius 19FirmicutesVeillonella_parvula 18FirmicutesDesulfotomaculum_acetoxidans 17FusobacteriaSebaldella_termitidis 16FusobacteriaLeptotrichia_buccalis 15FusobacteriaStreptobacillus_moniliformis 14SpirochaetesBrachyspira_murdochii 13BacteroidetesPlanctomyces_limnophilus 12BacteroidetesRhodothermus_marinus 11BacteroidetesCapnocytophaga_ochracea 10BacteroidetesChitinophaga_pinensis 09BacteroidetesPedobacter_heparinus 08BacteroidetesSpirosoma_linguale 07BacteroidetesDyadobacter_fermentans 06EpsilonproteobacteriaSulfurospirillum_deleyianum 05DeferribacteresDenitrovibrio_acetiphilus 04DeltaproteobacteriaHaliangium_ochraceum 03DeltaproteobacteriaDesulfomicrobium_baculatum 02DeltaproteobacteriaDesulfohalobium_retbaense 01GammaproteobacteriaKangiella_koreensis 50
 short chain dehydrogenaseacyl-CoA synthetase two-component system response regulator (LuxR) HalobacteriaHalorhabdus_utahensis 55HalobacteriaHalomicrobium_mukohataei 54HalobacteriaHalogeometricum_borinquense 53AminanaerobiaThermanaerovibrio_acidaminovorans 52DeferribacteresDethiosulfovibrio_peptidovorans 51DeinococciMeiothermus_silvanus 50DeinococciMeiothermus_ruber 49ChloroflexiThermobaculum_terrenum 48ChloroflexiSphaerobacter_thermophilus 47ActinobacteriaConexibacter_woesei 46ActinobacteriaAtopobium_parvulum 45ActinobacteriaSlackia_heliotrinireducens 44ActinobacteriaEggerthella_lenta 43ActinobacteriaCryptobacterium_curtum 42ActinobacteriaAcidimicrobium_ferrooxidans 41ActinobacteriaKribbella_flavida 40ActinobacteriaCatenulispora_acidiphila 39ActinobacteriaStackebrandtia_nassauensis 38ActinobacteriaGeodermatophilus_obscurus 37ActinobacteriaNakamurella_multipartita 36ActinobacteriaActinosynnema_mirum 35ActinobacteriaSaccharomonospora_viridis 34ActinobacteriaTsukamurella_paurometabola 33ActinobacteriaGordonia_bronchialis 32ActinobacteriaStreptosporangium_roseum 31ActinobacteriaThermobispora_bispora 30ActinobacteriaThermomonospora_curvata 29ActinobacteriaNocardiopsis_dassonvillei 28ActinobacteriaKytococcus_sedentarius 27ActinobacteriaBrachybacterium_faecium 26ActinobacteriaBeutenbergia_cavernae 25ActinobacteriaCellulomonas_flavigena 24ActinobacteriaXylanimonas_cellulosilytica 23ActinobacteriaJonesia_denitrificans 22ActinobacteriaSanguibacter_keddieii 21FirmicutesAnaerococcus_prevotii 20FirmicutesAlicyclobacillus_acidocaldarius 19FirmicutesVeillonella_parvula 18FirmicutesDesulfotomaculum_acetoxidans 17FusobacteriaSebaldella_termitidis 16FusobacteriaLeptotrichia_buccalis 15FusobacteriaStreptobacillus_moniliformis 14SpirochaetesBrachyspira_murdochii 13BacteroidetesPlanctomyces_limnophilus 12BacteroidetesRhodothermus_marinus 11BacteroidetesCapnocytophaga_ochracea 10BacteroidetesChitinophaga_pinensis 09BacteroidetesPedobacter_heparinus 08BacteroidetesSpirosoma_linguale 07BacteroidetesDyadobacter_fermentans 06EpsilonproteobacteriaSulfurospirillum_deleyianum 05DeferribacteresDenitrovibrio_acetiphilus 04DeltaproteobacteriaHaliangium_ochraceum 03DeltaproteobacteriaDesulfomicrobium_baculatum 02DeltaproteobacteriaDesulfohalobium_retbaense 01GammaproteobacteriaKangiella_koreensis 50")
14
phylum specific family 26/56 Actinobacteria Gene numberFrom Actinobacteria by chance 10.4643 20.2157 30.1001 40.0465 50.0216 60.0100 70.0047 80.0022 90.0010 100.0005

15
712 families (size >=10) are phylum specific Family size Organism number 0 50 100 150 200 250 300 350 0 5 10 15 20 25 42670
 are phylum specific Family size Organism number")
16
Family sizeActonobacteriaBacteroidetesDeinococciFirmicutesFusobacteriaHalobacteria 10<= x <20 4303711520494 20<= x <30 10392114 30<= x <40 225128 40<= x <50 7119 50<= x <60 66 60<= x <70 415 70<= x <80 112 80<= x <90 314 90<= x <100 22 100<= x 336 5815811623 Phylum-specific families from more than two organisms

17
F2699 Bacteroidetes=303; outer membrane protein *F2752 Actinobacteria=160; RNA polymerase, sigma-24 subunit, ECF family F2772 Bacteroidetes=147; putative ECF-type RNA polymerase sigma factor F2801 Actinobacteria=129; DNA-binding protein F2827 Bacteroidetes=114; FtsX-related transmembrane transport protein F2867 Actinobacteria=103; unknown functions The largest 6 phylum-specific families * From 15 organisms

18
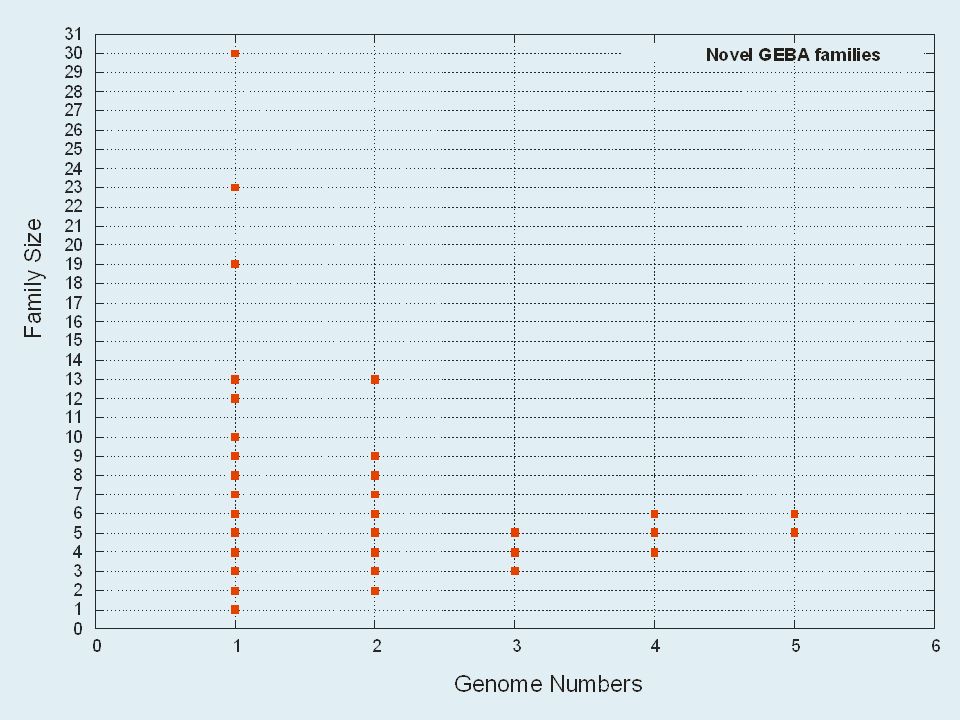
Novel gene families: None of the genes in a family has a Genbank hit (e cutoff: 1e-5)
")
20
Streptococcus agalactiae “pan-genome” Tettelin H. et.al. PNAS 2005;102:13950-13955

21
217,079 genes from 53 GEBA Bacterial genomes 60024 familiesN genomes Number of families with the selected genomes A:N from1 to 53 B:For every N, sample the families 100 times

22
0 10000 20000 30000 40000 50000 60000 70000 0 10 20 30 40 50 60 70 80 Bacteria from GEBA project Genome Number Gene Family Number (including families with single members) 0 500 1000 1500 2000 2500 3000 0 10 20 30 40 50 60 Number of Genomes New Genome families
 Number of Genomes New Genome families")
23
Actinobacteria: (73 genomes, including 26 GEBA genomes) Streptococcus agalactiae (8 strains) Enterobacteriaceae: (40 genomes) 9Escherichia coli 7Yersinia pestis 6Salmonella enterica 3Shigella flexneri Bacteria: (53 GEBA genomes)
 Streptococcus agalactiae (8 strains) Enterobacteriaceae: (40 genomes) 9Escherichia coli 7Yersinia pestis 6Salmonella enterica 3Shigella flexneri Bacteria: (53 GEBA genomes)")
24
Bacteria from GEBA project Genome Number Gene Family Number (including families with single members)
")
25
Genome Number Total Gene Number

26
S. agalactiae Enterobacteriaceae Actinobacteria Bacteria from GEBA project Total Gene Number Gene Family Number

27
Calculate the PD (Phylogenetic Diversity) Of a sub-tree
 Of a sub-tree")
28
Bacteria from GEBA project Genome Number Phylogenetic Diversity

29
Bacteria from GEBA project Phylogenetic Diversity Gene Family Number

30
How far down the road GEBA has to go in terms of PD coverage 232812 Bacterial/Archaeal ss-rRNA from Greengenes 45997 clusters MCL99% Identity at 80% span 42426 Greengenes Bacterial/Archaeal ss-rRNA 667 Combo Bacterial ss-rRNA 50 Combo Archaeal ss-rRNA 56 GEBA ss-rRNA Retrieve alignments from greengenes QuickTree Distant Tree for all representatives Filter out ss-rRNA from Genome Porjects 99% identity cutoffs Filter out 18751 low-quality sequences short sequences <=1200nt low-quality sequences duplicates chimerics Trim by the greengenes mask

31
74437 non-environmental Bacterial/Archaeal ss-rRNA from Greengenes 10397 clusters MCL99% Identity at 80% span 9946 Greengenes Bacterial/Archaeal ss-rRNA 667 Combo Bacterial ss-rRNA 50 Combo Archaeal ss-rRNA 56 GEBA ss-rRNA Retrieve alignments from greengenes QuickTree Distant Tree for non-environmental representatives Filter out ss-rRNA from Genome Porjects 99% identity cutoffs Filter out low-quality sequences short sequences <=1200nt low-quality sequences duplicates chimerics Trim by the greengenes mask

32
GEBA Pre-GEBA Greengenes *start from Haemophilus influenzae Rd KW20 **In each group, the taxa are sorted by their PD contributions in descending order

33
600 400 200 0 800 1000 1200 0 5000 10000 15000 20000 25000 30000 35000 40000 100 80 60 40 20 0 04008001200 GEBA genomes pre-GEBA genomes Organisms from the greengenes database (excluding environmental samples) Organism Numbers Phylogenetic Diversity
 Organism Numbers Phylogenetic Diversity")
34
The slopes of the linear regression Lines represent the PD contribution of the genomes (each window contains 50 genomes)
")
35
Only the top 150 PD contributors out of 717 pre-GEBA genomes have an average PD contribution greater than the GEBA genomes. The genome sequencing efforts have only covered 11.5% phylogenetic diversity to date in this study. We can pick an additional 550 organisms and still have an average PD contribution greater than or equal to the 56 GEBA genomes To increase PD coverage to 50%, we need to sequence at least 1520 more genomes Non-environmental Tree

36
All-representative Tree Current genome sequences only cover 2.2% of the PD We can pick an additional 4400 organisms and still have an average PD contribution greater than or equal to the 56 GEBA genomes To cover 50% of the phylogenetic diversity, we have to sequences 9218 more genomes

37
rbcL

38
rbcL Active sites Catalytic RuBP binding

39
Glycerate-3-P P-glyceroyl-P GAPDHAPFructose-1,6-P Fructose-6-P Xylulose-P Ribulose-5-P Ribulose-1,5-P CO 2 rbcL pgk gap tpiA glpX tktA rpe Calvin cycle

40
OrganismphylumrpeprkrbcLrbcSpgk Thermomonospora_curvata_DSM_43183ActinobacteriaxxIxx Meiothermus_silvanus_DSM_0994DeinococcixxI,IVxx Acidimicrobium_ferrooxidansActinobacteriaxxIxx *Halogeometricum_borinquense_DSM_11551HalobacteriaxIIIx Halomicrobium_mukohataei_DSM_12286HalobacteriaxIIIx Alicyclobacillus_acidocaldarius_subspFirmicutesxxIVx Meiothermus_ruber_DSM_01279DeinococcixxIVx Nakamurella_multipartita_DSM_44233ActinobacteriaxxIV Planctomyces_limnophilus_DSM_03776BacteroidetesxIVx Rhodothermus_marinus_DSM_4252BacteroidetesxxIVx Veillonella_parvula_DSM_02008FirmicutesxIVx Geodermatophilus_obscurus_DSM_43160ActinobacteriaxxVx Pedobacter_heparinus_DSM_02366BacteroidetesxxVx Dyadobacter_fermentans_DSM_18053BacteroidetesxxVx Calvin Cycle * Finished genome

Similar presentations
 A2 is online We considered the basics of sequence alignment –Opt score.>")


>")


