Download presentation
Presentation is loading. Please wait.

2
Dimension being tested Remained constant during testing

3
Making threshold measurements requires choices about the values to select for the stimulus dimensions that are not being measured Five needed special care in their selection: Wavelength, size, and duration are three characteristics of the stimulus. Two characteristics related to the observer also had to be selected with care: The retinal location that was stimulated and The adaptive state of the observer’s eye Only the stimulus intensity was altered from trial to trial

4
Retinal Location

5
They aimed the spot of light 20 degrees temporal on the retina

6
Fig. 2.1

7
Wavelength 400 nm 500 nm600 nm700 nm

9
Fig. 2.2 Left eye, temporal retina They used “monochromatic” light – but what wavelength to use to get lowest threshold?

10
Wavelength 400 nm 500 nm600 nm700 nm | |

11
Stimulus S i z e 10’ (minutes of arc) = 1/6th of a degree Any bigger would have “wasted” light
 = 1/6th of a degree Any bigger would have wasted light")
12
Fig. 2.3

13
Photons that are absorbed anywhere within a small region (<15 min. of arc) will add together
 will add together")
14
Photons that are absorbed outside a certain size area do not add together This is because of the wiring of the retina – which produces the “receptive field” of cells

15
The receptive field of a neuron is the region on the retina where light can produce a response from the cell

16
Receptive field (center) of on bipolar is the diameter of the single cone that connects to it (Not concerned here with the R-F “surround” because: dark adapted & very low stimulus levels)
 of on bipolar is the diameter of the single cone that connects to it (Not concerned here with the R-F surround because: dark adapted & very low stimulus levels)")
17
Receptive field of this bipolar is the diameter of the all the cones that connect to it

18
Receptive field of this ganglion cell is the diameter of all the cones that connect to it through the bipolar cells

20
Rods show even more convergence (larger receptive fields) Fig. 2.3
 Fig. 2.3")
21
Rods show even more convergence (larger receptive fields) Fig. 2.3
 Fig. 2.3")
22
Rods show even more convergence (larger receptive fields) Fig. 2.3
 Fig. 2.3")
23
For maximum effect (lowest threshold) want all of your photons to “count” – to add together
 want all of your photons to count – to add together")
24
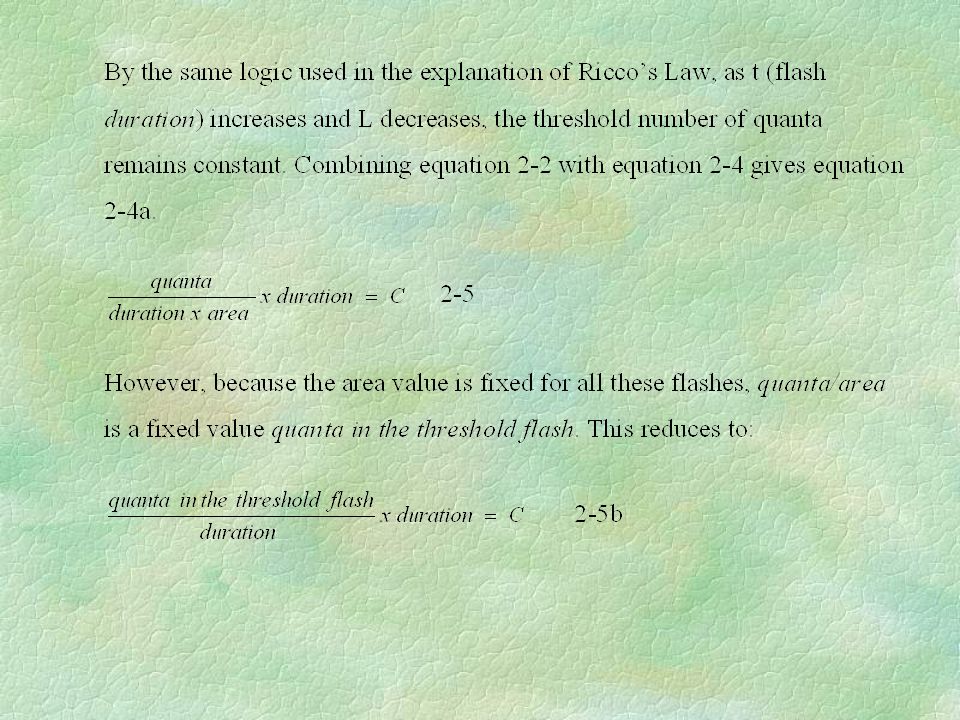
Hecht, Shlaer & Pirenne didn’t know about receptive-field sizes – the wiring of the retina had not been as thoroughly studied as it now has been. What they did know was that the number of photons needed to reach threshold was a constant until a test spot became too large. This is summarized as Ricco’s Law

26
Fig. 2.4

30
Ricco’s Law Piper’s Law

32
Back to the parameters used by Hecht et al. Location: 20 degrees temporal Wavelength: 510 nm Size: 10’ diameter Duration: Adaptation:

33
Stimulus duration

34
Fig. 2.2

35
Fig. 2.3 Time (msec)
")
36
Fig. 2.3 Time (msec)
")
37
Fig. 2.3 Time (msec)
")
38
Fig. 2.3 Time (msec)
")
39
Fig. 2.3 Time (msec)
")
41
Fig. 2.5

44
The Adaptive State of the Subject’s Eye

46
Location: 20 degrees temporal Wavelength: 510 nm Size: 10’ diameter Duration: 1 ms Adaptation: 30 min in dark before starting The Method of Constant Stimuli was used to measure the threshold

47
Fig. 2.6

48
Fig. 2.2

49
Fig. 2.3

50
Because the number of rods in the area stimulated by the flash was large in comparison to the number of quanta, the odds of two quanta being absorbed by one rod were small. Therefore, one quanta must be sufficient to stimulate one rod.

51
Figure courtesy of Diana Niculescu, PhD, DVM

52
One quantum can excite a rod Fig. 2.10

53
The data points are the actual data from Hecht, Shlaer and Pirenne. How did they come up with the psychometric functions that fit the data? They used logic to come up with the “right” shape of function, based on the fact that there must have been variability in the number of quanta in each flash.

54
Suppose the subject’s threshold was perfect, but the number of quanta in a flash varied…. How closely could they match this psychometric function just by stimulus variability? Assume a fixed threshold, but variability in the amount of light.

55
The number of quanta in each flash of a series of light flashes varies with predictable randomness A “Poisson” distribution The variance of a Poisson distribution is equal to the mean value

56
Fig. 2.7 So, with a fixed threshold (for instance, 8 or more photons), the percent “yes” responses changes depending on how many quanta are in the flash, on average. Remember, they did not know exactly how many quanta were in any one flash!
, the percent yes responses changes depending on how many quanta are in the flash, on average. Remember, they did not know exactly how many quanta were in any one flash!.")
57
Inverse cumulative distribution for a Poisson distribution with a mean of 8 quanta per flash. Fig. 2.8 They worked out the shape of the psychometric function with a threshold of 8 or more and variation in the number of quant in each flash. Step 1: Use inverse cumulative distribution to find fraction of “yes” responses with threshold of 8 and mean of 8 Mean = 8 quanta 0.547 (54.7%) of the flashes contain more than 7, so a subject with a threshold of 8 would see 54.7% of the flashes
 of the flashes contain more than 7, so a subject with a threshold of 8 would see 54.7% of the flashes.")
58
Fig. 2.9 Step 2: they generated a full psychometric function for threshold = 8 and flashes with various mean number of quanta Mean = 8 Mean = 6 Mean = 4 Mean = 10

59
Fig. 2.9 Step 3: they constructed different psychometric functions by assuming different thresholds Mean = 8 Mean = 6 Mean = 4 Mean = 10 >4 >7 >16 >4

60
They found the psychometric function that matched the shape of the real data

61
But remember, all this was assuming that there was NO subject variability.

62
Fig. 2.6

Similar presentations


. How do we do it?>")


>")


 Main topics –convergence –Inhibition, lateral.>")

