Download presentation
Presentation is loading. Please wait.

1
Actuarial Financial Scenario Generator Project Sponsored by the Casualty Actuarial Society and the Society of Actuaries Kevin Ahlgrim, ASA, Bradley University Stephen D’Arcy, FCAS, University of Illinois Richard Gorvett, FCAS, Zurich North America Presented at Victoria University Wellington, New Zealand February 2003

2
Overview of Project CAS/SOA Request for Proposals on: Economic Scenario Generators for Dynamic Financial Analysis and Cash Flow Testing Goal is to provide actuaries a model for projecting economic and financial indices with realistic interdependencies among the variables.

3
Scope of Project Literature review Develop economic (financial) scenario generator model Generate scenarios over 50 year time horizon Document and facilitate use of model
 scenario generator model Generate scenarios over 50 year time horizon Document and facilitate use of model")
4
Components of Model Inflation Real interest rates Nominal interest rates Equity returns –Large stocks –Small stocks Equity dividend yields Real estate returns Unemployment

5
Inflation One factor mean reverting process Speed of reversion:.4 Mean reversion level: 4.8%

6
Real Interest Rates Two factor Vasicek term structure model Short term rate and long term mean are both stochastic variables

7
Nominal Interest Rates Combines inflation and real interest rates i = (1+q)x(1+r)-1 i = nominal interest rate q = inflation r = real interest rate
x(1+r)-1 i = nominal interest rate q = inflation r = real interest rate")
8
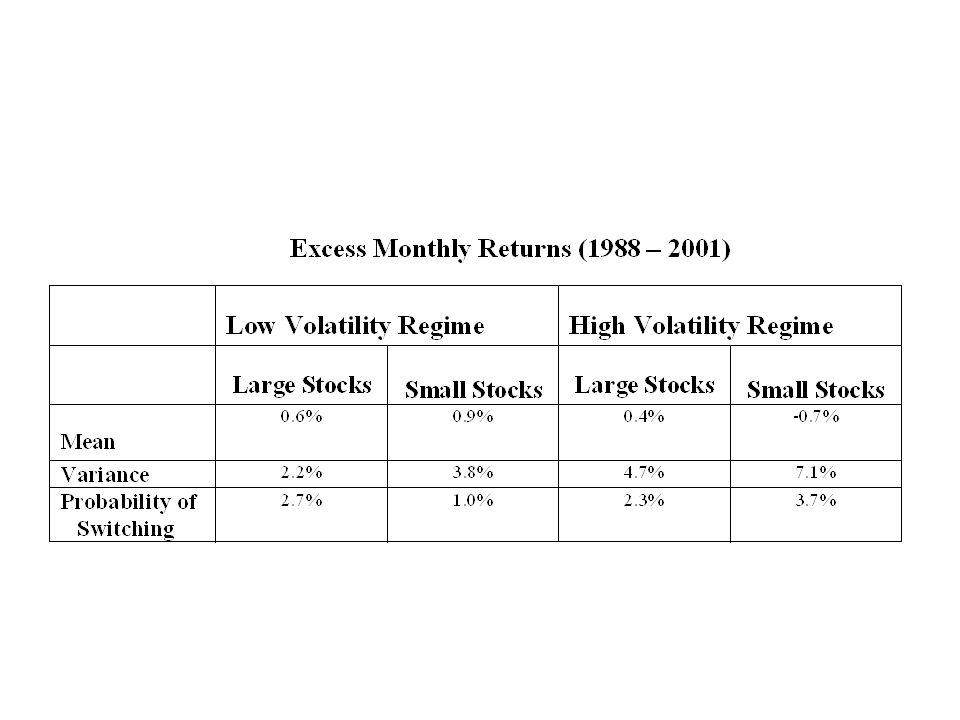
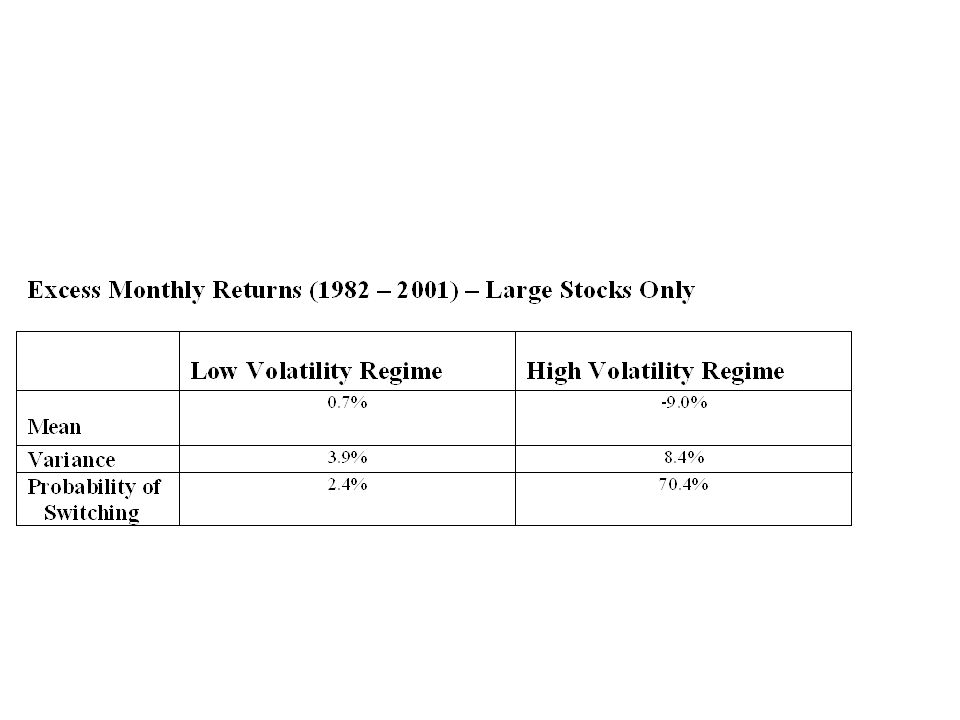
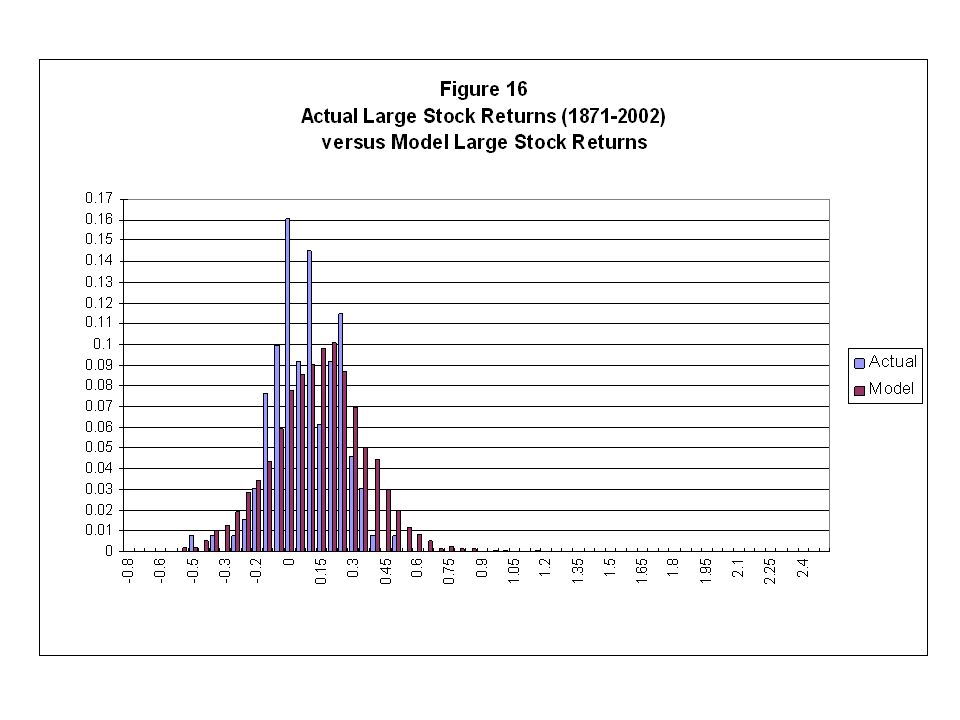
Equity Returns Excess equity returns (over the nominal interest rate) Empirical “fat tails” issue Regime switching model –Low volatility regime –High volatility regime
 Empirical fat tails issue Regime switching model –Low volatility regime –High volatility regime")
11
Unemployment Phillips curve –Inverse relationship between unemployment and inflation First order autoregressive process

12
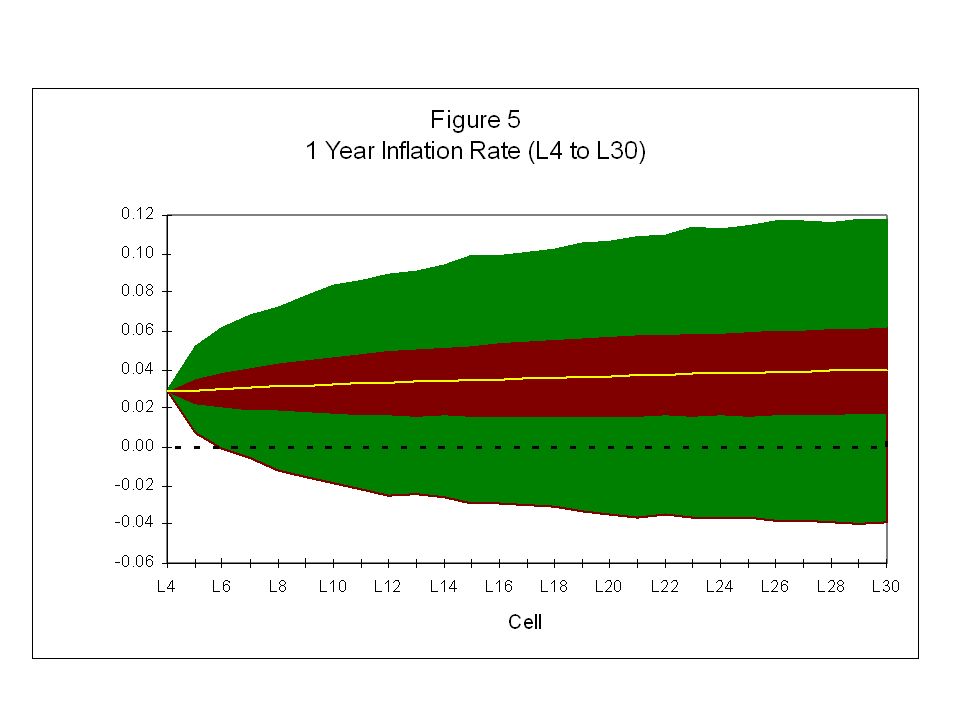
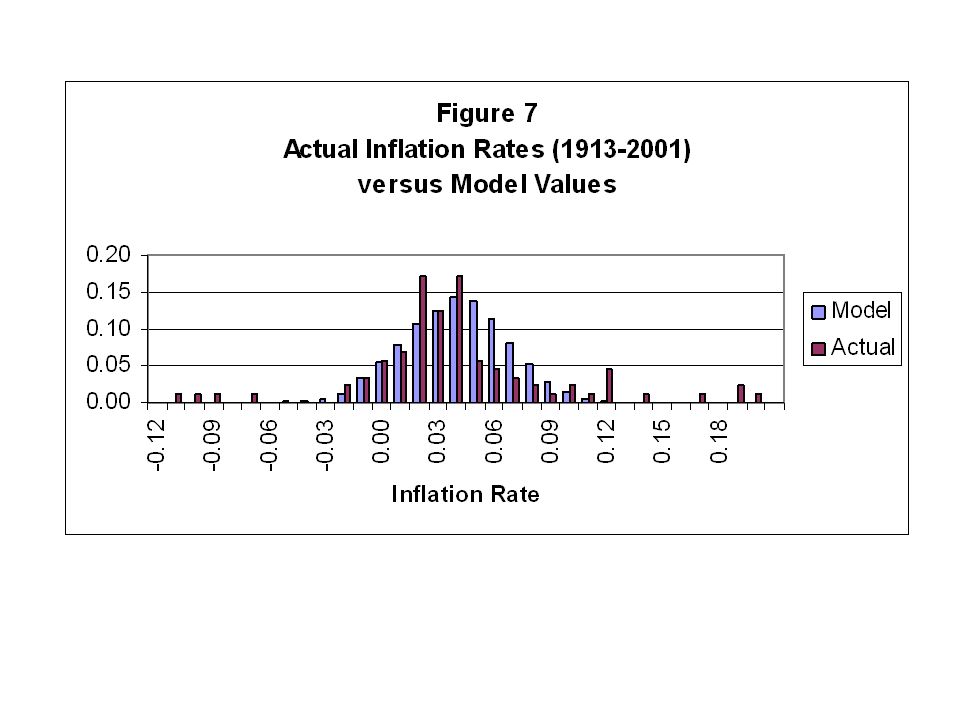
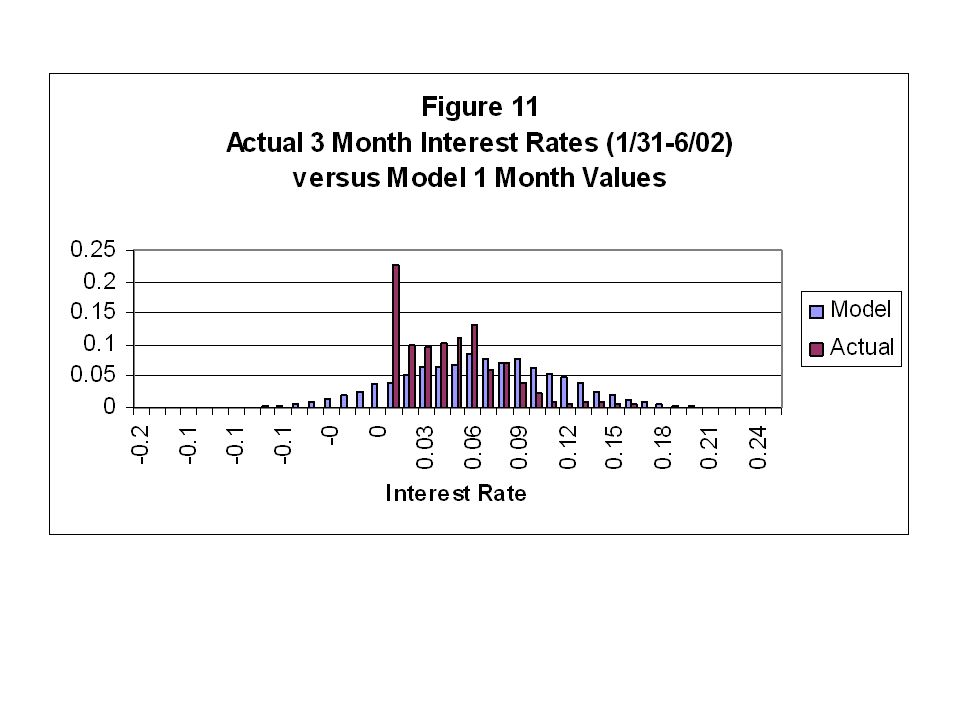
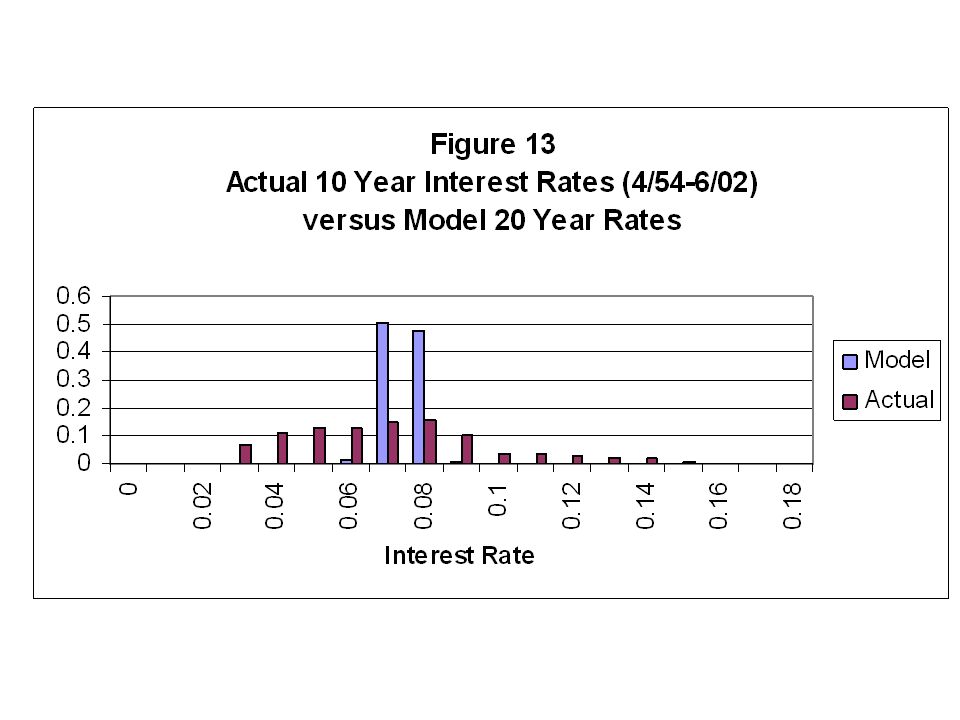
Results Funnel of doubt plots Histograms of Actual Values vs. Model Values –Inflation –Nominal interest rates 3 month 1 year 10 year –Equity returns Large stocks Small stocks Unemployment rate

Similar presentations


 for a Malaysian Participating Annuity Fund 14th EAST ASIAN ACTUARIAL CONFERENCE Prepared by.>")


 2001 Contemporary Engineering Economics 1 Chapter 6 Principles of Investing Investing in Financial Assets Investment Strategies Investing in Stocks.>")


