Download presentation
Presentation is loading. Please wait.

1
Mad Day Trader Bill Davis Webinar – July 29, 2015

2
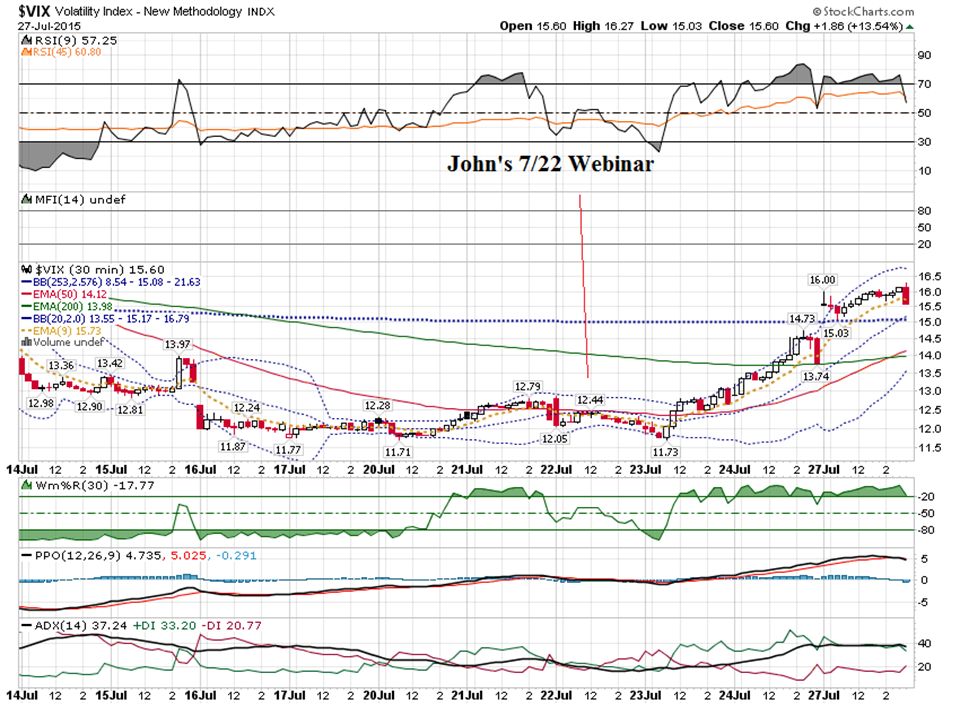
I want to continue the discussion on integrating the VIX with the Market turning points.

3
As I said in yesterday’s daily update, I mentioned how on John’s Webinar last week that the market was at an inflection point.

4
Today, I want to show you what that means and the implications. John’s webinar was on Wednesday July 22, 2015. Today I want to show why I said that.

5
Let’s look at some charts of the S & P 500 and the VIX

8
Now let’s look at these charts with the resistance levels.

11
Let’s scope down to a 10 minute chart of the VIX …

13
You still apply your basic technical tools to the VIX. The main ones I use are moving averages and the Extreme Bollinger Bands.

14
The % move on the VIX will NOT correlate to the same % move on the markets!

15
The only thing the VIX is telling you is if the market will reverse and when you can expect a reversal. It does this by reversing off a resistance level.

16
Because we are in earnings season and there have been a number of outstanding moves, I would like to discuss how to look at a company reporting.

17
This was prompted by a member asking me my thoughts on trading AMZN BEFORE earnings came out.

18
You may have seen some of the incredible moves off earnings this quarter … GOOGL – Up $97.84 CMG – Up $52.75 ILMN – Down $20.05 SNDK – Up $9.52 AMZN – Up $47.24 And I could go on …

19
The market makers know that traders will straddle or strangle options BEFORE earnings so they inflate the Implied Volatility, making the options more expensive.

20
If you have ever bought calls before earnings and watched the stock go up, but lost money on your calls you know what I mean. This is because of the inflated option prices.

21
Typically, after the earnings announcement, the Implied Volatility will return to normal. This is called the Volatility Crush.

22
The one thing we can do is estimate the move that the market makers expect.

23
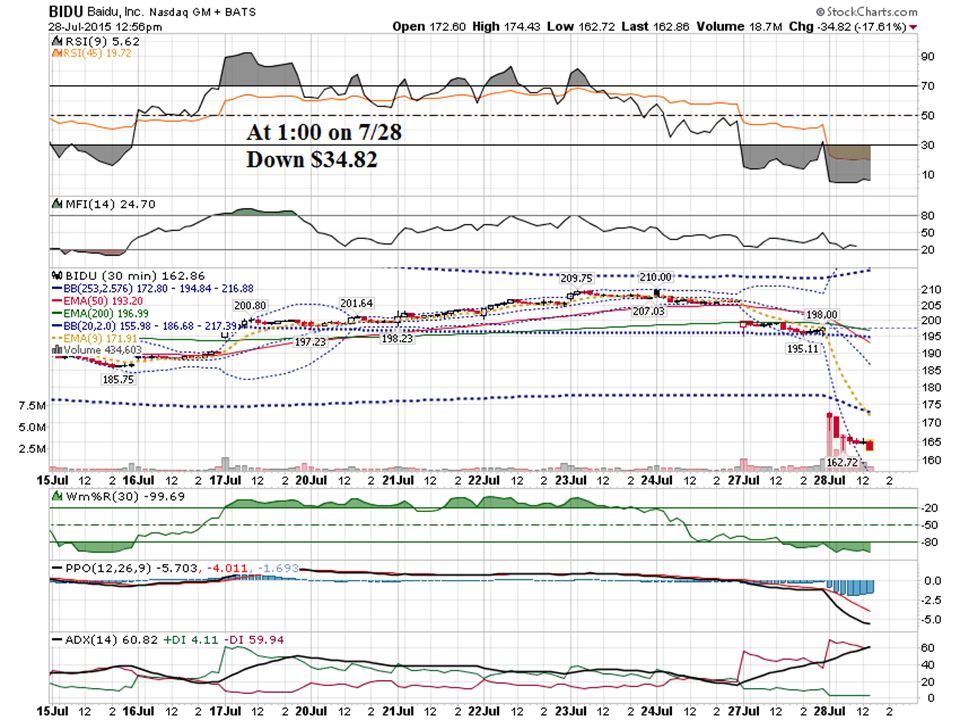
We do this by adding up the cost of the At the Money Call and the At the Money Put. I will use BIDU as an example. BIDU reported Monday after the close.

24
BIDU Close Monday 7/27/15 @ $197.68 $197.50 call closed @ $9.60 $197.50 put closed @ $9.50 Total = $19.10 Projected move = 9.66%

26
BIDU ATM Straddle $197.50 Call - $9.60 $197.50 Put - $9.50 $19.10 After Earnings; $197.50 Call - $.02 $197.50 Put - $33.00 Profit = $13.90 or 73% overnight

27
BIDU moved almost 75% more than what the market makers projected, so the straddle made money. But if BIDU moved only what the market makers projected, this deal would have lost money!

28
Here is what I like to do. Take the projected move and add a 50% cushion. So, 1.50% of $19 = $28.50

29
Then I price out a spread above and below the closing price and add the 50% cushion.

30
$197.50 + 28.50 = $226 $197.50 – 28.50 = $169 Then price out spreads using the 150 cushion.

31
Call Spread: Sell the $225 Call @ $1.80 Buy the $230 Call @ $.92 Net credit of.88 per contract or 17.6 % max value

32
Put Spread: Sell the $170 Put @ $.82 Buy the $165 Put for $.50 Net Credit = $.32 or 6.4% max value.

33
The first question you have to ask yourself is this. Would you have done the put side? The call side paid 17.6% and the put side paid 6.4%!

34
There was one technical condition that had me biased to BIDU selling off. Can you guess what that was?

35
The prior day BIDU Gapped Down.

37
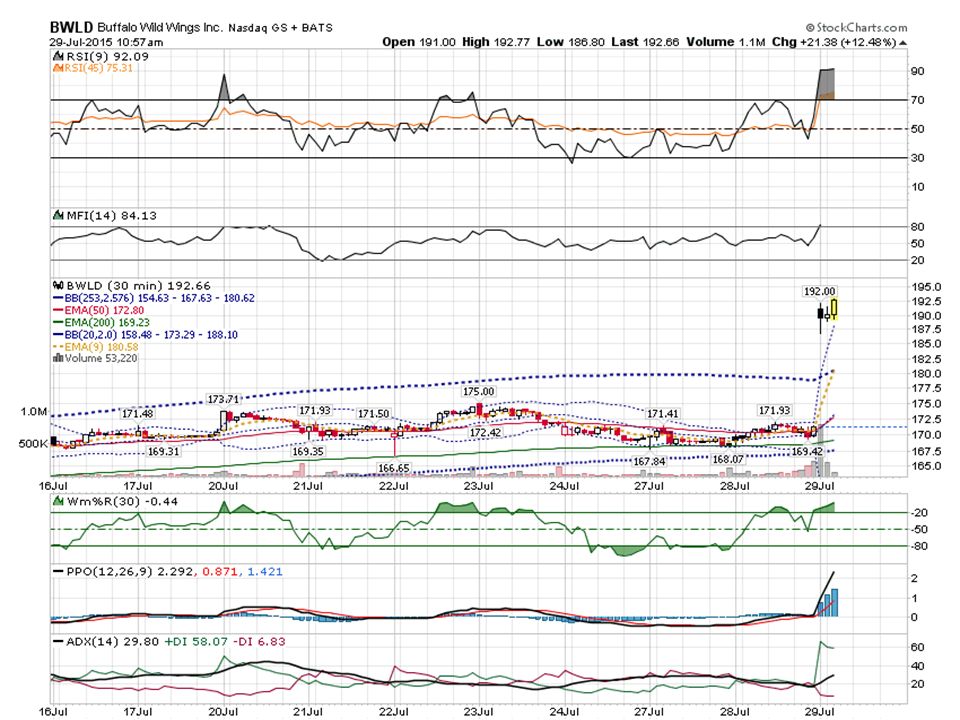
Let’s apply the same analysis to a company that reported last night … BWLD

39
BWLD Closed on 7/28 @ $171.28 $170 Call @ $9.36 $170 Put @ $8.10 Total = $17.46 17.46/171.28 = 10.2% Projected

40
$17.50 x 1.50 = $26 $195 C @ $1.57 $200 C @ $.99 Net Credit = $.58 11.6% Return $145 P @ $1.08 $140 P @ $.60 Net Credit = $.48 9.6% Return

41
Let’s look at BWLD Today …

43
BWLD Project Move = $17.46 Move today = $21.38 or 12.48% Exceeded Projection by $3.92

44
$170 Call @ $9.36 $21.10 $170 Put @ $8.10.30 Total = $17.46 $21.40 Profit = $3.94 or 22.5% With a move that exceeded the projection by 12.5%

46
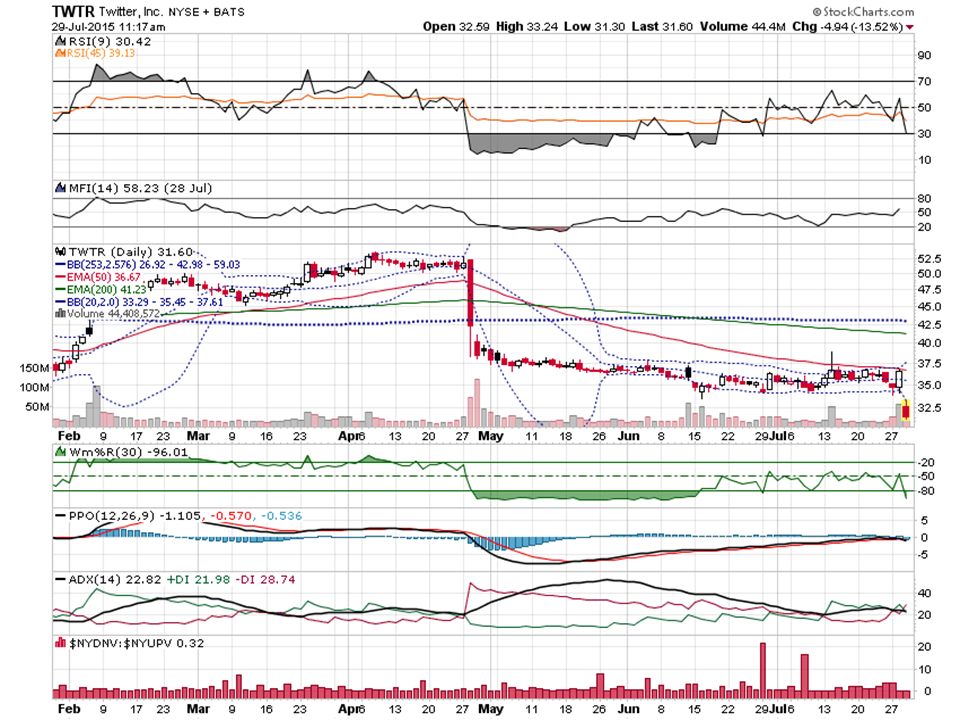
If you trade intra day, you want to look at companies that have made big gaps off earnings … especially on Fridays when the leverage is the greatest!

47
Stocks that make a big gap moves off earnings are great candidates for shorter term trading! The more strikes it cross the better!

48
Let’s use AMZN as an example. AMZN reported on Thursday July 23 rd after the close and gapped up almost $100.

50
To help time your entry, you can scope down to a shorter timeframe.

53
You can always trade using a straddle or strangle!

54
Thanks for watching! Bill Davis Mad Day Trader July 29, 2015 davismdt@gmail.com

Similar presentations


 -Debit Spread -Shorter Term Trade (1 – 3 weeks before.>")


 1 - Capital Budgeting (Investment) 2 - Capital Structure (Financing) Today We are leaving.>")


 There is a tendency for options to dramatically.>")