Download presentation
Presentation is loading. Please wait.

1
Experimental part: Measurement the energy deposition profile for U ions with energies E=100 MeV/u - 1 GeV/u in iron and copper. Measurement the residual activation doses induced by U ions of energies E=100MeV/u - 1 GeV/u in iron and copper targets. A.Golubev Project Meeting GSI 01.06.04. INTAS Ref. # 03-54-3588 Experimental and Theoretical Study of Energy Deposition and Residual Activation Induced by Uranium Ions to Model the Beam Loss Hazards in the GSI Future Facility GSI, Darmstadt - Germany ITEP, Moscow - Russia VNIIEF, Sarov - Russia INR RAS, Troizk - Russia SUT, Bratislava - Slovakia

2
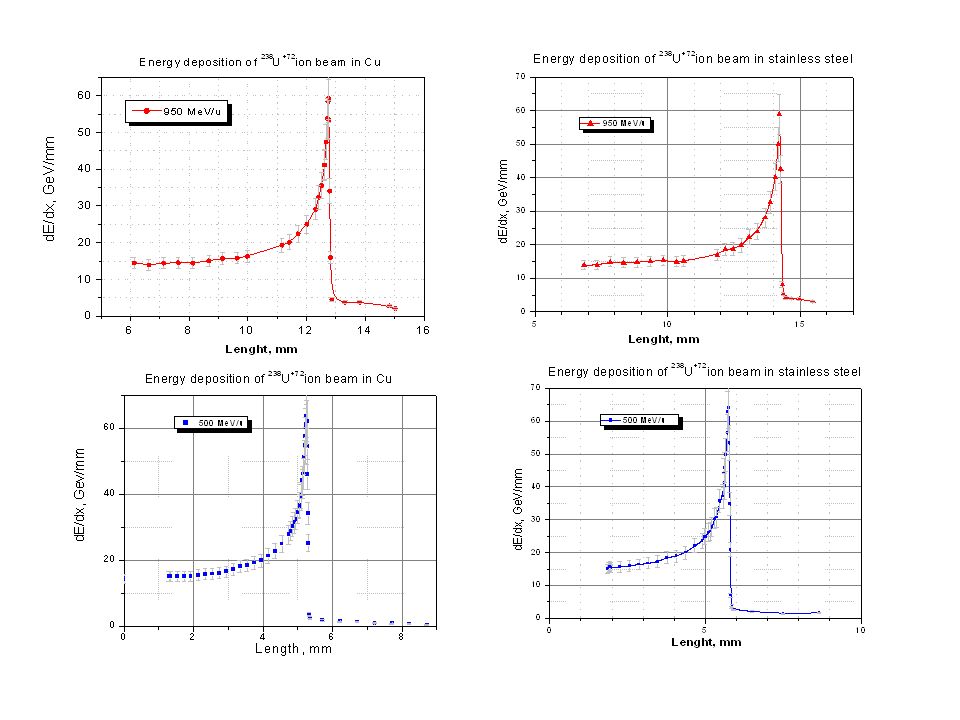
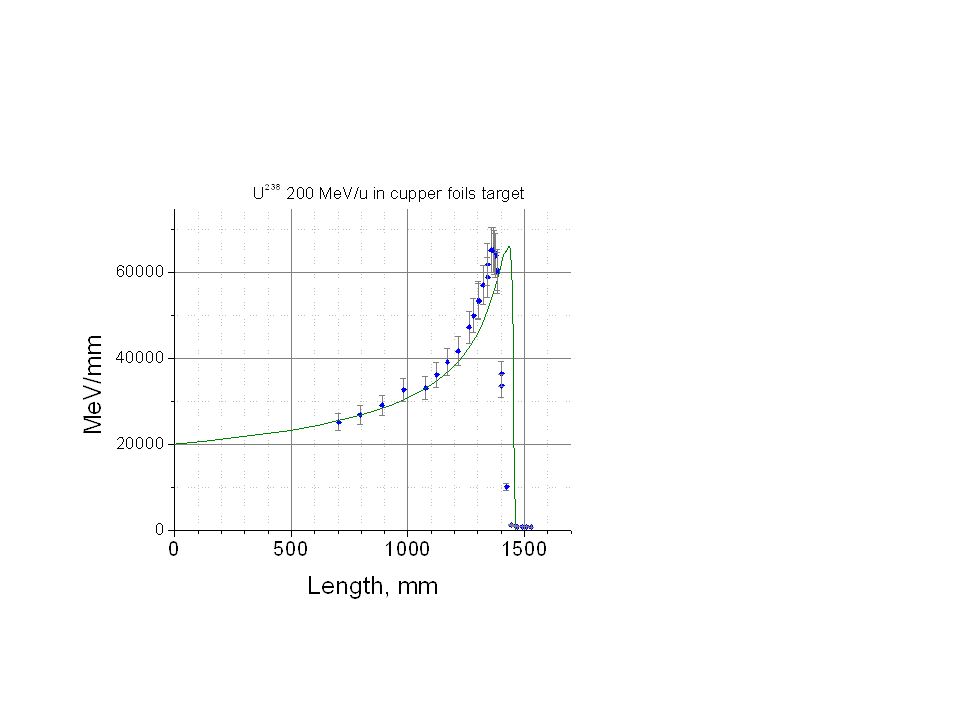
"Thick target" approach for precise measurement of energy deposition profile dE/dx and total stopping range This method using thick targets of variable thickness, determined with high precision and registration of the energy deposition along the total ion stopping range by thin calorimeters detectors The precision of the method is determined by the detector parameters (energy resolution, registration efficiency, detection threshold, etc. depending on a detector type) the precision of the target thickness measurement. This method has been developed in collaboration between ITEP, VNIIEF and GSI. GSI experiment S249. Why need to use ‘thick target’ approach for measurement of total ion energy deposition ranges in solids Because: it provides direct measurement of the energy deposition range, rather than its reconstruction from measured differential energy loss; it enables to eliminate the ‘edge effects’, as compared to ‘thin foil’ approach; it takes account of the beam straggling and fragmentation, secondary particles etc.
 the precision of the target thickness measurement. This method has been developed in collaboration between ITEP, VNIIEF and GSI. GSI experiment S249. Why need to use ‘thick target’ approach for measurement of total ion energy deposition ranges in solids Because: it provides direct measurement of the energy deposition range, rather than its reconstruction from measured differential energy loss; it enables to eliminate the ‘edge effects’, as compared to ‘thin foil’ approach; it takes account of the beam straggling and fragmentation, secondary particles etc..")
3
Scheme of the experimental setup

4
Cave A experimental area

5
Calorimeter The calorimeter measures the change of temperature in a thin layer of material due to its heating by the passing ion beam. The calorimeter is enclosed in a metal case and consists of a receiving platform made of a foil attached to thermo-modules, which are fixed on a massive thermostat. The size of the device is Ø50x11mm. The aperture of the calorimeter is Ø15 mm. The detector sensitivity is 5mV/J. The total stopping range is thus measured with the error less than 3%. The error of the specific deposited energy measurement is 7%.

7
Measurement & Codes Range, mm Fe, 500Cu, 500Fe, 950Cu 950 Measurement5.9±0.25.3±0.214.3±0.412.8±0.4 ATIMA6.1 (1.6%)5.413.2 (7.7%)13.4 (4.7%) SRIM6.5 (8.3%)5.9 (9.4%)16.1 (12.6%)15.2 (18.6%) SHIELD5.95.415.1 (5.6%)14.1 (10%)
 (7.7%)13.4 (4.7%) SRIM6.5 (8.3%)5.9 (9.4%)16.1 (12.6%)15.2 (18.6%) SHIELD (5.6%)14.1 (10%)")
9
SIS100 operation with U beam The intensity of up to 10 12 ions of U +28 with energy of E=1 GeV/u is foreseen in the SIS100 synchrotron (~40 kW total power). The „ 1 W/m – criteria“ for the U beam in SIS100 would result in the allowed loss level below ~3% distributed uniformly along the ring, which is very tough and requires elaborated system of collimators in the ring (to distribute the „hot spots“ uniformly) overloaded by various equipments. But if the activation scales with the neutron yield then one may expect the tolerable heavy ion losses to be higher than 1 W/m: U ion with E=1 GeV/u produces about 458 neutrons/projectile (SHIELD code calculations), which is 5 time less compared to the neutron yield from the equivalent 238 protons with E=1 GeV (8.4 n/pr).
 overloaded by various equipments. But if the activation scales with the neutron yield then one may expect the tolerable heavy ion losses to be higher than 1 W/m: U ion with E=1 GeV/u produces about 458 neutrons/projectile (SHIELD code calculations), which is 5 time less compared to the neutron yield from the equivalent 238 protons with E=1 GeV (8.4 n/pr)..")
10
characterization of residual activity of selected components of the beam line (copper and stainless steel): dose rate measurements radioactive nuclides identification for the thick copper and stainless steel targets irradiated by the U beam with 100 – 1000 MeV/u energies range; long time prediction of radioactive inventory around the beam transport system Main topics of this research Experimental investigation of the radioactivity of the solid matter induced by heavy ion beam irradiation
: dose rate measurements radioactive nuclides identification for the thick copper and stainless steel targets irradiated by the U beam with 100 – 1000 MeV/u energies range; long time prediction of radioactive inventory around the beam transport system Main topics of this research Experimental investigation of the radioactivity of the solid matter induced by heavy ion beam irradiation")
11
Experimental setup for the measurements of induced radioactivity after irradiation with heavy ion beams

12
Experimental procedure for the measurements of radioactivity induced in Copper and Stainless Steel by fast Uranium ions NMaterial and configurationInitial energy of 238 U ions and calculated range* Target thickness, mm Total dose on the target (ions) ** 1 Fe – set of disks mm: 0.1, 0.5, 0.5 120 MeV/u –570.68 m (SRIM) 1.1 2.04*10 11 2 Cu – set of 11 disks of 0.1 mm120 MeV/u – 526.2 m (SRIM); 563 m (ATIMA) 1.1 3.32*10 11 3 Fe – set of 35 disks mm: 0.1, 0.5, 0.1, 0.5, 0.5 0.1, 0.5, 0.5, 0.1, 0.5, 0.5, 0.1, 0.5, 0.5, 0.1, 0.5, 0.5, 0.1, 0.1, 0.1, 0.5, 0.5, 0.1, 0.5, 0.5 0.1, 0.5, 0.5, 0.1, 0.5, 0.5, 0.1, 0.5, 0.5, 0.1. 500 MeV/u –6.28 mm (TRIM) 11.9 ~2*10 11 4Cu – set of 34 disks mm: 0.1, 0.5, 0.1, 1, 0.1, 0.5, 0.5, 0.1, 0.5, 0.5, 0.1, 0.5, 0.5, 0.1, 0.1, 0.1, 0.1, 0.1, 0.5, 0.5, 0.1, 0.5, 0.5, 0.1, 0.5, 0.5, 0.1, 0.5, 0.5, 0.1, 0.5, 0.5, 0.1 500 MeV/u – 5.34 mm (ATIMA), 5.79 mm (SRIM) 11 ~2*10 11 *Ranges were calculated with taking into account the energy losses in SEETRAM, 100 m Al window, and in 65 cm air; ** Preliminary estimated results
 11.9 ~2* Cu – set of 34 disks mm: 0.1, 0.5, 0.1, 1, 0.1, 0.5, 0.5, 0.1, 0.5, 0.5, 0.1, 0.5, 0.5, 0.1, 0.1, 0.1, 0.1, 0.1, 0.5, 0.5, 0.1, 0.5, 0.5, 0.1, 0.5, 0.5, 0.1, 0.5, 0.5, 0.1, 0.5, 0.5, MeV/u – 5.34 mm (ATIMA), 5.79 mm (SRIM) 11 ~2*10 11 *Ranges were calculated with taking into account the energy losses in SEETRAM, 100 m Al window, and in 65 cm air; ** Preliminary estimated results.")
13
Results of calibration of beam current detector by different ion beams

14
Air Al 100 m Secondary electron monitor Ionization chamber 600 mm Target “front“ surface (foil 0) Vacuum Ar Beam 50 mm Targets for the Argon beam irradiation Cu target set of disks mm: Energy of 40 Ar ions* and SRIM ranges Target thickness Total dose on the target (ions) 1,7, 1, 7, 1, 5, 1, 1, 1, 5, 1, 5, 1, 5, 1, 3, 1 500MeV/u 23.6 mm 47 mm4.8*10 11 1, 7, 1, 7, 1, 7, 1, 7, 1, 7, 1, 5, 1, 1, 1, 7, 1, 7, 1, 7, 1, 5, 1, 5, 1, 5, 1, 5, 1 800MeV/u 47.74 mm 97 mm1.2*10 11 1, 3, 1, 3, 1, 1, 1, 1, 3, 1, 5, 1 300MeV/u 10.64 mm 22 mm3*10 11 The one-millimeter foils were inserted after each thick disk, which allowed to obtained the spatial distribution of the activation rates in the copper target along the range. Besides that, the radionuclide spectra measurements were carried out for assembling. Based on these experimental data the predictions of the induced radioactivity of the accelerator equipment will made for continuous irradiation during normal operation.

15
Spatial distribution of activation rates of different nuclides in the copper target after 40 Ar E 0 =800MeV/u irradiation.

16
Conclusion. Measurement the energy deposition profile for U ions with energiesE=100 MeV/u - 1 GeV/u in iron and copper are finished and the stage of processing data now Measurement the residual activation doses induced by U ions of energies E=100MeV/u - 1 GeV/u in iron and copper targets are started.

Similar presentations


 : How to stop , , -rays and neutrons? Multi-Purpose Particle and Heavy Ion Transport code System title1 Feb. 2014 revised.>")

, M.Magistris (1,2), Th.Otto (2), M.Silari (2) (1) Politecnico di Milano; (2) CERN.>")


 especially suitable for deep-sited tumors (brain, neck.>")


, M.Magistris (1,2), Th.Otto (2), M.Silari (2)>")


 Yoshimi Kasugai on behalf of JASMIN Activation team JASMIN Activation team Y. Kasugai, K. Oishi, H. Matsumura,>")


