Download presentation
Presentation is loading. Please wait.

2
Evolution of Indian Power Grid Phenomenal expansion since Independence Generation : 1349 MW 101,866 MW (in 1947) (in 2001) Grid : Local grid – at the time of Independence. State Grids – emerged in 1960s. Regional Grids – in 1970s. Five Regional Grids – Northern, Western, Southern, Eastern & North-eastern National Grid – under progress.

3
Power Scenario – at a Glance Existing Installed capacity - 101,866 MW Coal – 71% Hydro – 25 Nuclear & others – 4% Peak demand Peak power - 78,000 MW Energy (average) - 1395 MU/day Availability Peak power - 68,000 MW Energy (average) - 1288 MU/day Shortage Peak power - 10,000 MW (12.8%) Energy - 107 MU/day (7.7%)
 MU/day Availability Peak power - 68,000 MW Energy (average) MU/day Shortage Peak power - 10,000 MW (12.8%) Energy MU/day (7.7%)")
4
Power Scenario – at a Glance All figs. are in MW RegionPeakInstalled Peak DemandCapacity Surplus/Deficit Northern21,00027, 000- 2,100 Western25,00030,800- 4,500 Southern20,40024,800- 2,600 Eastern 7,80015,700 + 2,000 North-eastern 950 1,800- 25 Limited exchange of power between Regions --- Main reasons: –Inadequate interconnectors, especially from Eastern Region –Lack of proper Commercial and administrative mechanisms

5
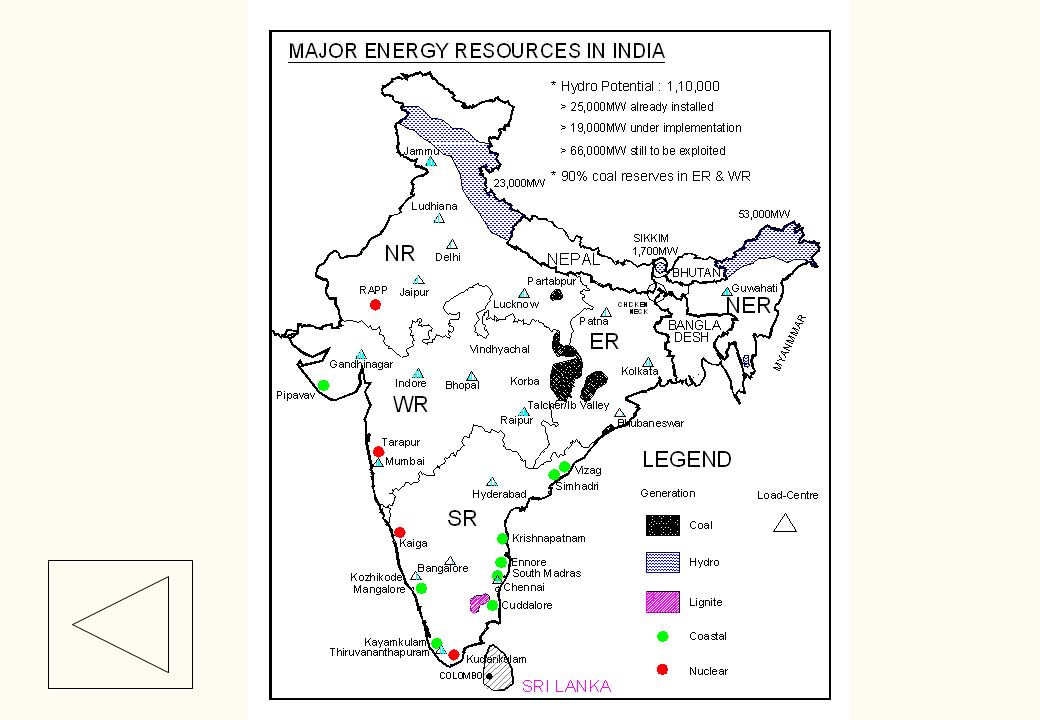
Need for National Grid Uneven disposition of energy resources Major Hydro resources in NER & NR Coal reserves mostly in Bihar/Orissa/West Bengal Cost of power transmission (1.11 cents/kwh) lower than cost of fuel transportation (3.33 cents/kwh). Some Regions are no longer Self-sufficient Major resources in SR exhausted In NR, mainly hydro resources having long gestation period Unbalanced Growth of different Regions Some regions are surplus and some are deficit. Optimisation of generation capacity addition Utilising time diversity Spinning reserve optimisation

6
Power Transfer Envisaged from ER and NER by 2012 Table

7
Development of National Grid – Major Considerations Development in a phased manner – commensurate with generation/ load growth Conservation of Right-of-Way - especially in areas with scarcity of ROW ---- viz. area near hydro, chicken-neck area, forest area, town etc. In forest area with rich flora & fauna, construction of line with high towers ---- no forest cutting required. Minimisation of transmission cost - immediate as well as long-term basis. Flexible enough to accommodate change in load-generation pattern.

8
Plan for National Grid PHASE-I (By 2002): Interconnection through HVDC Back-to-Back links- P North – West: 500MW Vindhyachal Back-to-Back Under P West – South: 1000MW Chandrapur Back-to-Back Opera- P East – South: 500MW Gazuwaka Back-to-Back tion P East – North: 500MW Sasaram Back-to-Back – expected by (AC line of this project in operation 2002 --- transferring 350 MW in radial mode) With the completion of Sasaram HVDC Back-to-back link, framework of National Grid would be completed. MAP

9
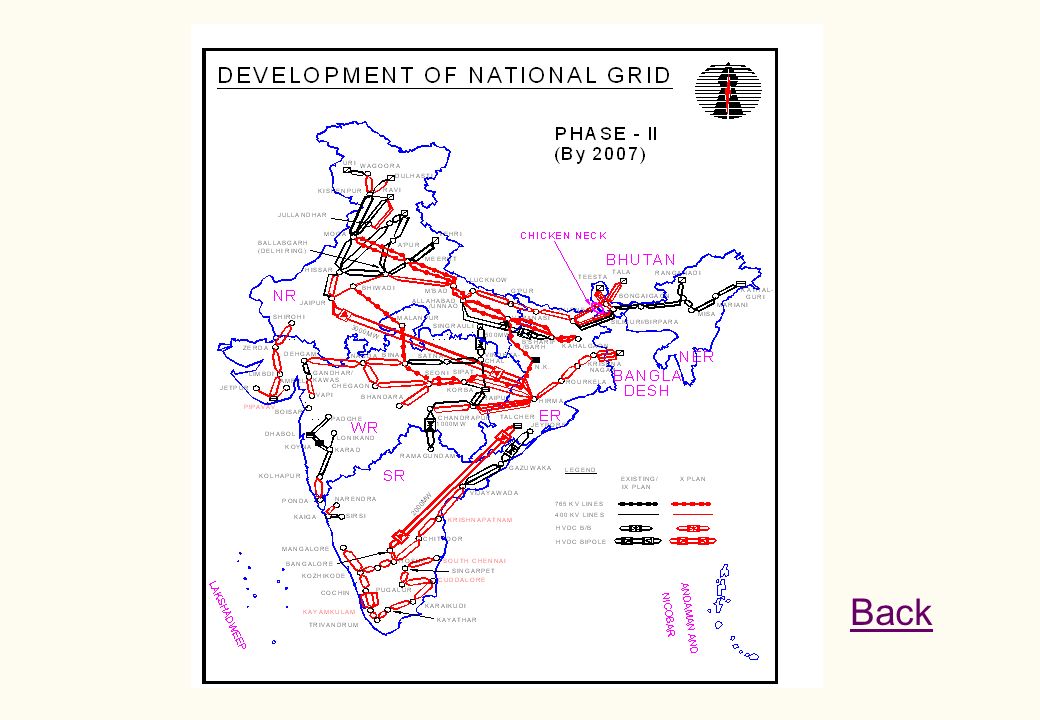
Plan for National Grid PHASE-II (By 2007): High capacity “Transmission highways” envisaged alongwith major generation projects - East-South 2000 MW HVDC bipole between Talcher-Kolar - 2003. Augmentation of Gazuwaka HVDC back-to-back by 500MW - 2004. East – North High capacity 400 kV link from Tala to Delhi - 2004. 2500 MW HVDC bipole between Hirma – Jaipur- 2005 East – West 400kV AC link between Rourkela and Raipur –2003 400kV AC link between Hirma and Raipur & Sipat - 2005.. MAP

10
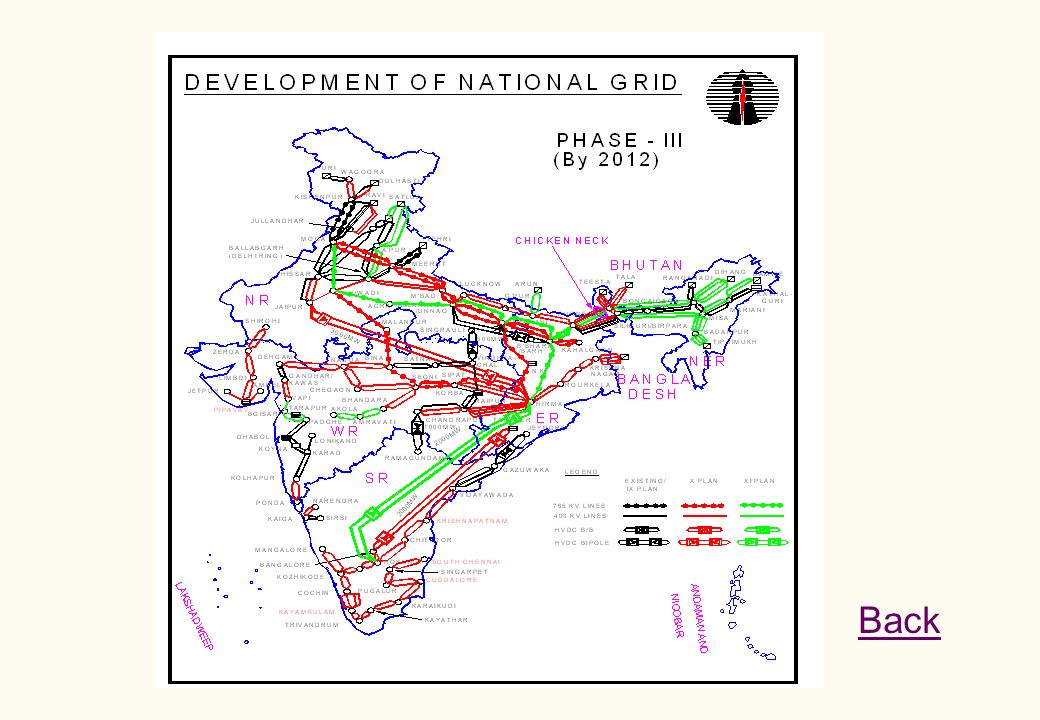
Plan for National Grid PHASE-III (By 2012): Establishment of a ring of 765kV lines traversing across Northern, Western and Eastern Regions Construction of various sections of Ring progressively along with major generation projects viz. Barh, Kahalgaon, North Karanpura etc. Strengthening of East-South interconnection through another 2500MW bipole MAP

11
National Grid: Cost-benefit analysis Cost Investment required Rs. 23,000 crores Benefits Reduction in capacity addition requirement by about 13750 MW--- hence saving on investment of Rs. 55,000 crore. (due to peak time diversity and saving in spinning reserve) Transmission highway would enable setting up of large pit head stations having lower cost of energy Savings on account of this - Rs. 9000 crores per annum. In addition, Nation’s investment towards fuel transportation infrastructure could be avoided. Better overall hydro-thermal mix Very low for ER and WR ( ER – 15 : 85, WR - 17 : 83 ) – affecting grid operation With National Grid, it would become 33 : 67 on all India basis..
 Transmission highway would enable setting up of large pit head stations having lower cost of energy Savings on account of this - Rs crores per annum. In addition, Nation’s investment towards fuel transportation infrastructure could be avoided. Better overall hydro-thermal mix Very low for ER and WR ( ER – 15 : 85, WR - 17 : 83 ) – affecting grid operation With National Grid, it would become 33 : 67 on all India basis...")
12
Major Challenges & their Redressal Mobilisation of Funds Considerable investment required for creation of National Grid Investment requirement in : Rs. 70,000 Cr Central transmission sector (including National Grid) by the year 2011-12 Investment by POWERGRID : Rs. 39,000 Cr Investment by Private Sector : Rs. 31,000 Cr POWERGRID facilitating private sector participation in transmission sector through Joint Venture and Independent Private Transmission Companies (IPTCs) routes
 by the year Investment by POWERGRID : Rs. 39,000 Cr Investment by Private Sector : Rs. 31,000 Cr POWERGRID facilitating private sector participation in transmission sector through Joint Venture and Independent Private Transmission Companies (IPTCs) routes.")
13
Major Challenges & their Redressal...contd. Private Sector Participation Joint Venture Route –Project specific Shell company for obtaining statutory approvals to offer bankable projects to private sector –Transmission system identified India portion for Tala Hydro Electric project (1020 MW) in Bhutan with an Estimated cost of Rs. 1,200 Cr –Proposed equity participation to the tune of 26% –NIT issued for Selection of JV partner through ICB IPTC Route –Selection of the promoter through two stages (RfQ & RfP) ICB based on Transmission Service Charges (TSC) –International consultant appointed under the technical assistance(TA) of ADB – Transmission licensee to establish the project under BOOT –A pilot project to be taken up shortly.
 in Bhutan with an Estimated cost of Rs. 1,200 Cr –Proposed equity participation to the tune of 26% –NIT issued for Selection of JV partner through ICB IPTC Route –Selection of the promoter through two stages (RfQ & RfP) ICB based on Transmission Service Charges (TSC) –International consultant appointed under the technical assistance(TA) of ADB – Transmission licensee to establish the project under BOOT –A pilot project to be taken up shortly..")
14
Major Challenges & their Redressal...contd. Realisation of Investment Total Charges of SEBs due to POWERGRID is about 1385Cr. Including surcharge of 317cr. as on July 2001. As National Grid is planned on long term basis, its utilisation in initial period will be less --- hence, transmission charges would be on higher side. SEBs may be reluctant to pay higher transmission charges. Poor recovery can affect health of POWERGRID --- hence future development of transmission system. Perceived Solution: Special methodology need to be adopted for recovery of tr. charges of Transmission highways.

15
Major Challenges & their Redressal...contd Proper Load Despatch & Communication Facilities POWERGRID is implementing ULDC schemes in all five regions with state-of-art- SCADA, EMS and dedicated Communication system at an investment of US $468 million. Schemes for NR & SR under implementatin, expected by Jun’2002. Establishment of National Load Despatch Centre (NLDC) by interconnecting all the regions. Integrated Grid Operation Strict adherence to grid discipline to maintenance of voltage and frequency. Operation of generating units in free governor mode. Implementation of “Availability Tariff” having provision of penalties and incentives to encourage grid discipline.
 by interconnecting all the regions. Integrated Grid Operation Strict adherence to grid discipline to maintenance of voltage and frequency. Operation of generating units in free governor mode. Implementation of Availability Tariff having provision of penalties and incentives to encourage grid discipline..")
16
Comprises of: Capacity charge Energy charge Unscheduled interchange charge Dependent on Actual Plant Availability & generation / drawal No provision regarding deemed generation No year-end commercial adjustments Perpetual incentive for maximizing generation & reducing drawal during deficit, but no incentive to over generate during surplus Availability based Tariff

17
Defines responsibilities between Utilities, RLDCs and REBs Defines scheduling mechanism for day ahead scheduling of Generation and Drawal Specified frequency bands for operation of regional grids Frequency stabilization through free governor mode of generating units Defines charge for Reactive Energy drawal Indian Electricity Grid Code

19
Eastern Region – Power Scenario Effective Installed Capacity: 15,958 MW Demand Peak : 7800 MW (persists for 3-4 hrs a day). Off-peak : 4500 MW (persists for 20 hrs a day). Surplus Available - In peak hours : 2000 MW Extent of max. surplus : 3500 MW Additional surplus power would be available with injection of power from Ranganadi HEP (405MW – expected by March 2002).
. Surplus Available - In peak hours : 2000 MW Extent of max. surplus : 3500 MW Additional surplus power would be available with injection of power from Ranganadi HEP (405MW – expected by March 2002)..")
20
Eastern Region – Power Scenario.. contd. Surplus Available with 68% average PLF - In peak hours : 4500 MW Extent of max. surplus : 6000 MW At the end of X - Plan - Likely increase in Installed Capacity: 6500 MW Likely increase in Load: 2500 MW Likely increase in Surplus power: 3000 MW Therefore, the surplus scenario is likely to continue in future also.

21
Reasons for Surplus Power Poor load growth - 5% as compared to national average of 9% due to - Non-completion of state sector transmission scheme approved long back. Inadequate sub-transmission & distribution facilities. Overall slow economic growth of the Region. Adequate Inter- regional transmission links were not planned – as power was to be consumed in ER only.

22
On-Going Schemes LinkCapacity (MW)Expected comm. ER to NR Sasaram HVDC B-t-B (AC line is being utilised for transfer of 300MW, with HVDC 500MW would be transferred on regular basis) 500Dec, 2002 ER to WR Rourkela – Raipur 400kV D/c (Award placed) 700Dec, 2002
 500Dec, 2002 ER to WR Rourkela – Raipur 400kV D/c (Award placed) 700Dec,")
23
Additional Links - Proposal Feasible Capacity to evacuate Surplus Power (MW) Estimated Cost (Rs. in Crs.) I.Tala-Delhi Transmission System2000 II.Gazuwaka – II ; augmentation by 500MW block 500790 III.Series Capacitor on Raipur – Rourkela 400kV D/c Raipur-Chandrapur 400 kV D/c 500260 IV.Sasaram – II ; augmentation by 500MW block 500350 V.Ib Valley – Jaipur HVDC Bipole of Hirma Tr. system 25003300 VI.Meramundali – Hosur 2000MW HVDC bipole 20003500 Total800010,200
 I.Tala-Delhi Transmission System2000 II.Gazuwaka – II ; augmentation by 500MW block III.Series Capacitor on Raipur – Rourkela 400kV D/c Raipur-Chandrapur 400 kV D/c IV.Sasaram – II ; augmentation by 500MW block V.Ib Valley – Jaipur HVDC Bipole of Hirma Tr. system VI.Meramundali – Hosur 2000MW HVDC bipole Total800010,200.")
25
Back

28
Demand-Availability Scenario – by 2011-12 Assumptions: Demand – as per 16 th Electric Power Survey Report (EPS). Capacity addition – as per information available from MoP & CEA. Generation availability (average) – 75%. All figs. are in MW Region Demand Installed Availability Deficit/ Capacity Surplus Northern 49000 52354 39265 - 9735 Western 46000 53343 40007 - 5993 Southern 42000 50075 37556 - 4444 Eastern+ North-east 19000 44275 33206+ 14206
 – 75%. All figs. are in MW Region Demand Installed Availability Deficit/ Capacity Surplus Northern Western Southern Eastern+ North-east")
29
`````````` Sl. NO. Tariff Parameter Norms as per GOI Notification (Existing Norms) Norms Recommended by CERC Fin. Impact (2001-02) Rs. Crs. 1.ROE16% - 2.DEPT/L-5.27%, S/s-7.84%, PLCC- 12.77%, BLDG-3.02% T/L-2.57%, S/s-3.6%(-)355.68 3.O&M1.5% for plain and 2% for hilly terrain On the basis of actual O&M in last 5 years (-)4.48 4.FERVAs per actual. To be billed annuallyTo be capitalized and charged in tariff. FERV on interest also allowed. (-)62.17 5.Treatment of Corporate Tax Grossing up of income-tax permitted Tax recovery on actual basis, to be calculated in advance and billed on monthly basis. (-)4.02 6.Normative availability & incentive 95% for recovery of full transmission charges 1% increase on ROE for each % point of increase in availability beyond 95% 98% for recovery of full transmission charges. (-)59.81
 Norms Recommended by CERC Fin. Impact ( ) Rs. Crs. 1.ROE16% - 2.DEPT/L-5.27%, S/s-7.84%, PLCC %, BLDG-3.02% T/L-2.57%, S/s-3.6%(-) O&M1.5% for plain and 2% for hilly terrain On the basis of actual O&M in last 5 years (-) FERVAs per actual. To be billed annuallyTo be capitalized and charged in tariff. FERV on interest also allowed. (-) Treatment of Corporate Tax Grossing up of income-tax permitted Tax recovery on actual basis, to be calculated in advance and billed on monthly basis. (-) Normative availability & incentive 95% for recovery of full transmission charges 1% increase on ROE for each % point of increase in availability beyond 95% 98% for recovery of full transmission charges. (-)")
Similar presentations


 - Bhanu Bhushan ->")


, CEA.>")
, Government of India November 16, 2006 Power Ministers’ Conference on.>")

 India - Present Power Scenario Total Installed Capacity – 228.7 GW (As on 30.09.13)>")
 : 2-3 March 2015 Rim.>")


