Download presentation
Presentation is loading. Please wait.

1
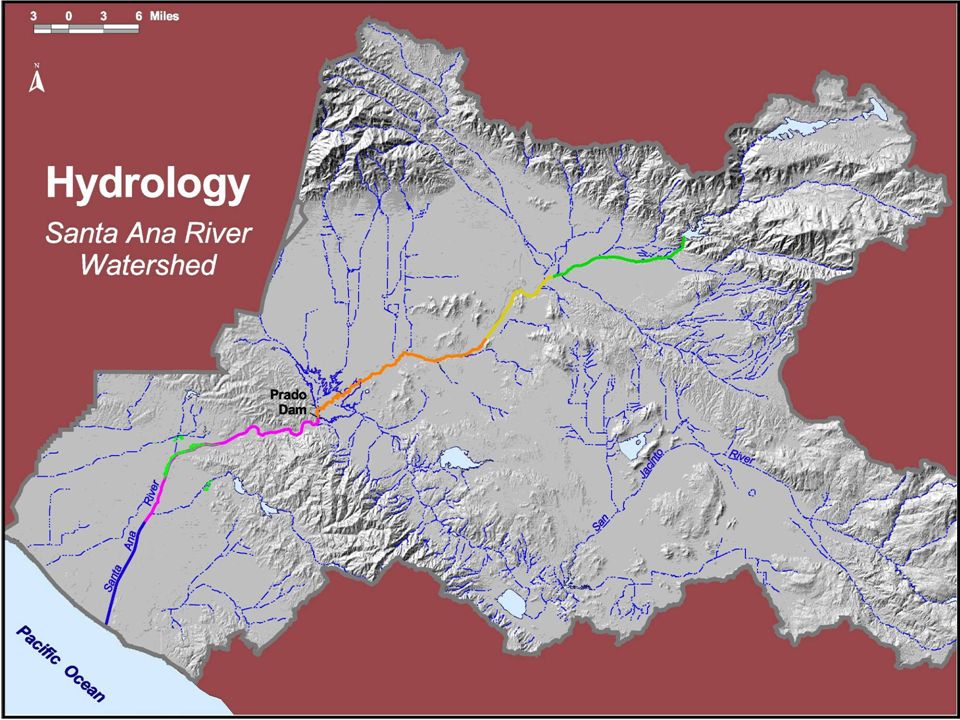
Salinity Management Project Santa Ana Region Gerard Thibeault Executive Officer January 26, 2007

2
State of California Water Quality Control Regions 1 5 6 2 3 4 7 8 9 1. North Coast 2. San Francisco Bay 3. Central Coast 4. Los Angeles 5. Central Valley 6. Lahontan 7. Colorado River 8. Santa Ana 9. San Diego

6
Need for Updated Salt Management Plan Discharger Concerns –TDS Limitations –Objectives – 1972 Rushed, under funded Not based on good science No good data on assimilative capacity If 1972 objectives invalid –Potential for enormous unnecessary expenditures of public funds

7
Genesis of Salt Management Plan Dischargers and water agencies appealed to Regional Board for complete review of salt management plan Regional Board agreed to evaluate objectives –Two-edged sword

8
Develop procedures to calculate groundwater quality objectives –1972 Basin Plan Objectives: Significantly under-funded effort TDS: About 200 wells; Two years of data Nitrate objectives not scientifically calculated –TIN/TDS Study: TDS/Nitrate: About 1,800 wells; 20 years of data Nitrate and TDS objectives rigorously calculated

9
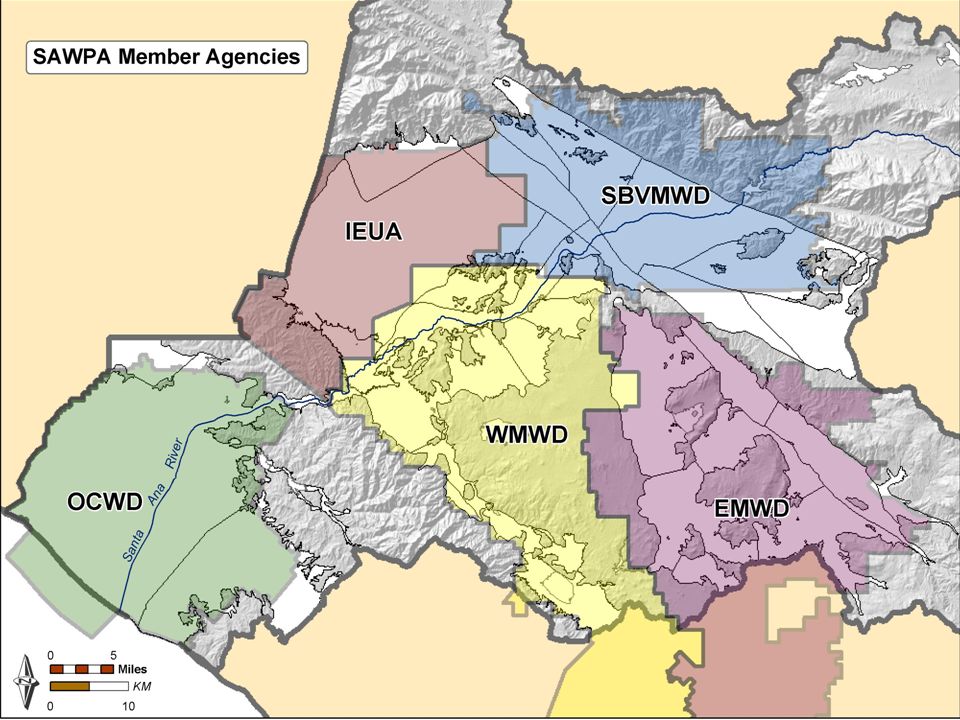
Santa Ana Basin Salt Management Plan N/TDS Task Force – 7 years, water supply agencies (upper and lower basins), wastewater dischargers, USGS, Watermaster Funded by Task Force members –Approx. $3.5 million

10
Basin Plan Amendment Bottom Line 90 page staff report 99 page basin plan amendment Numerous public workshops and hearings Complete assessment and adoption of new objectives and boundaries throughout Region Adopted by Reg Bd, State Bd, and OAL WITHOUT dissent or opposition

11
N/TDS Task Force All factions within the basin represented –Upper Basin v. Orange County –Water Supply Agencies v. WW dischargers Consensus-building process Establish ground rules Strict conformance with existing laws and federal and state policies

12
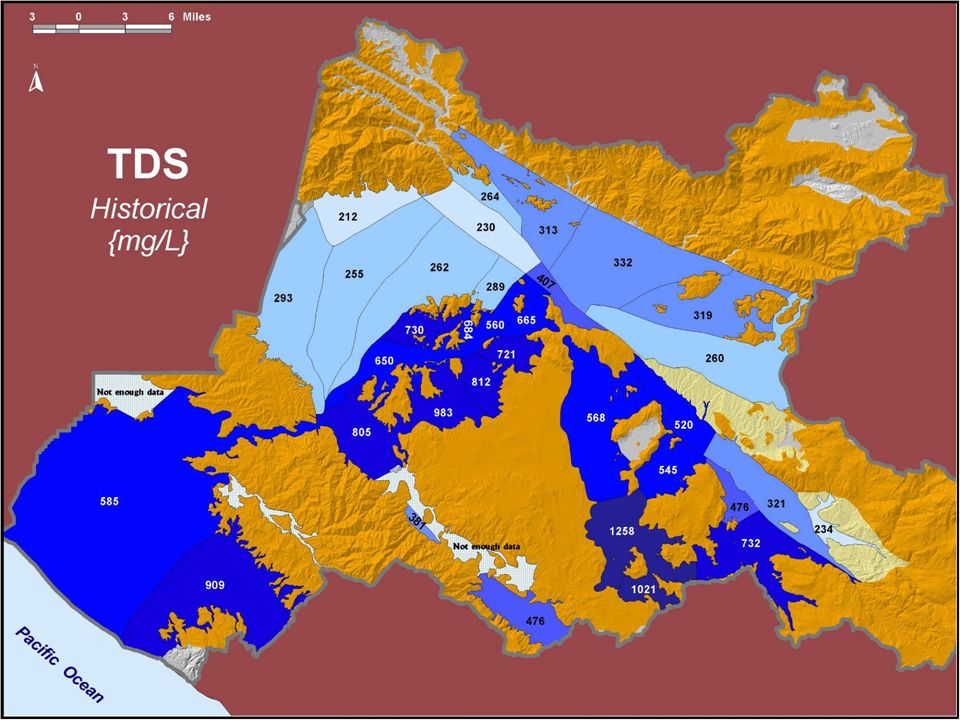
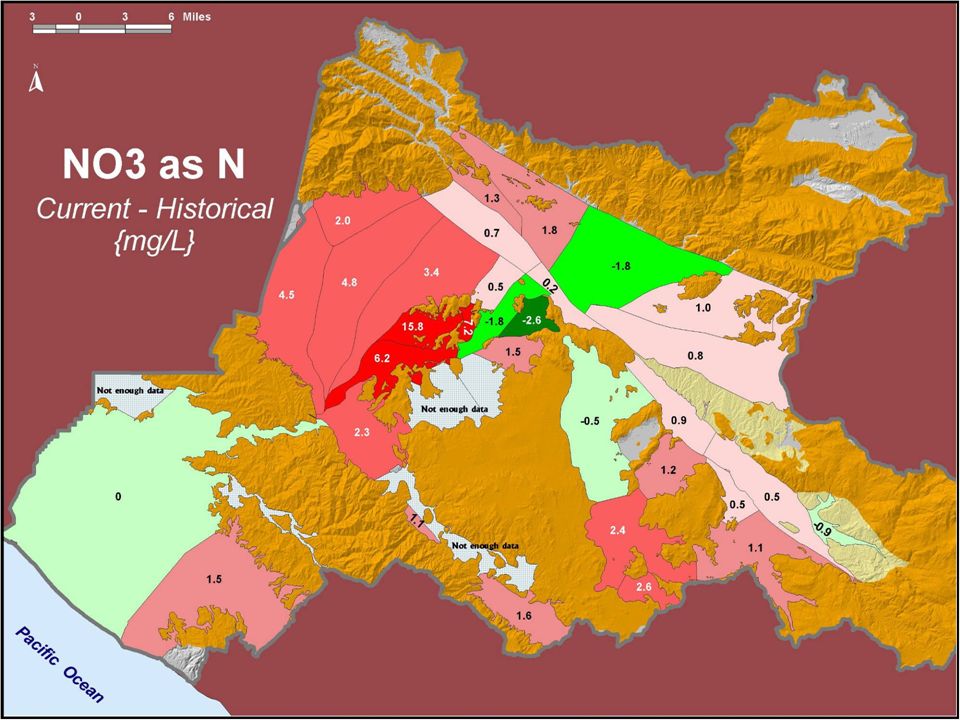
N/TDS Task Force Complete scientific review of historic and current ambient water quality 20-Year running averages All wells in region with 3 or more data points and quality control Thousands of data points Developed nitrogen, TDS and water level maps for every 2 years since 1950 for entire region

13
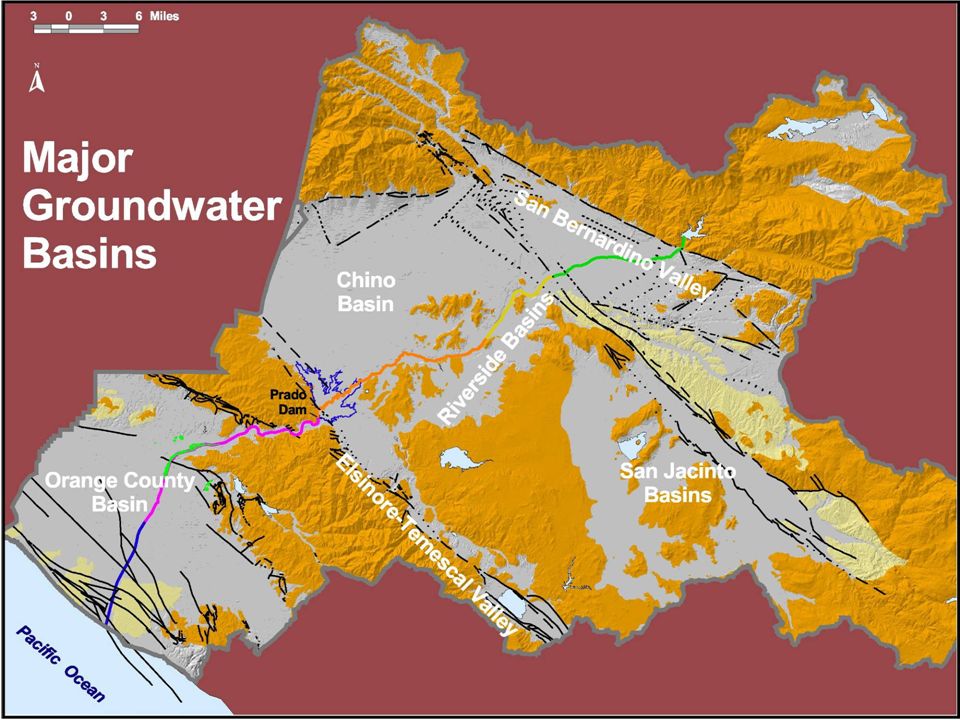
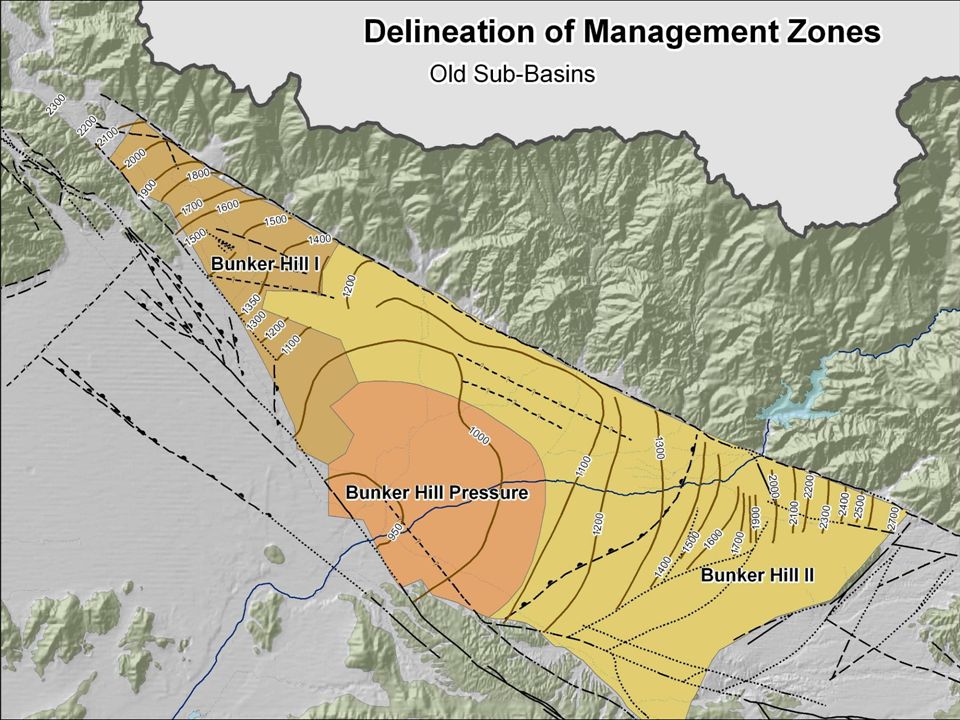
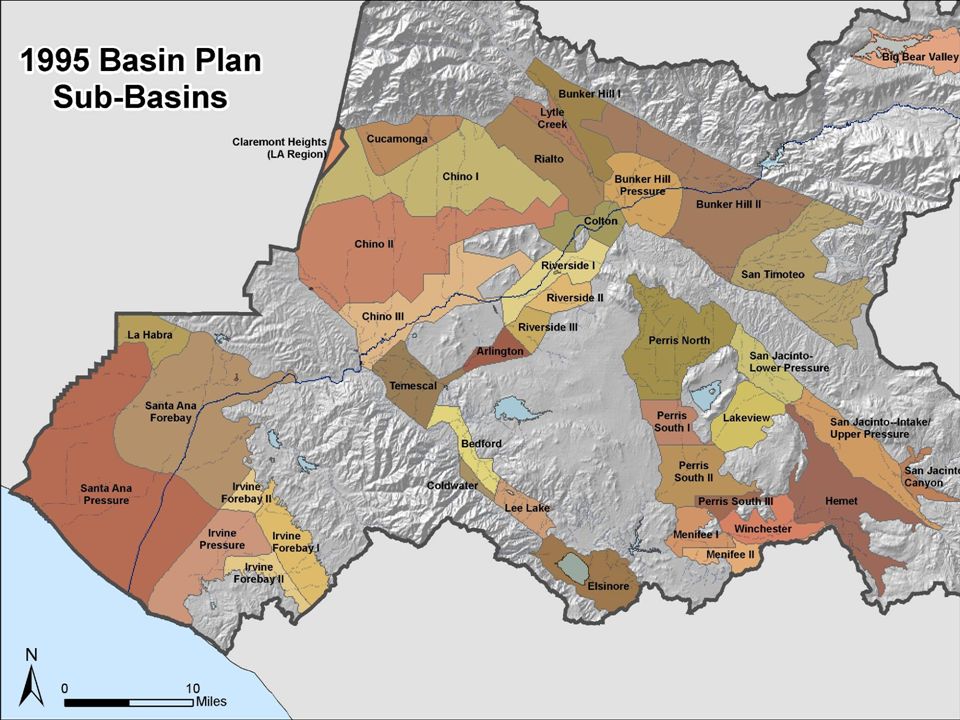
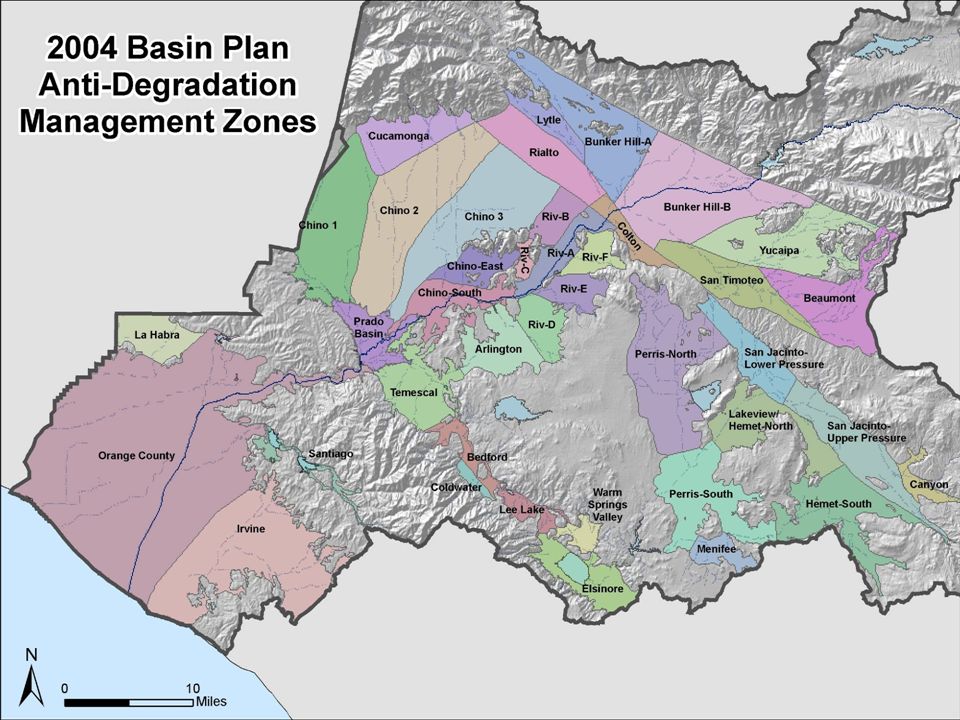
N/TDS Task Force Hydrogeotechnical review of all groundwater basin boundaries All boundaries digitized Mass-weighted analysis of historic and current ambient groundwater quality

14
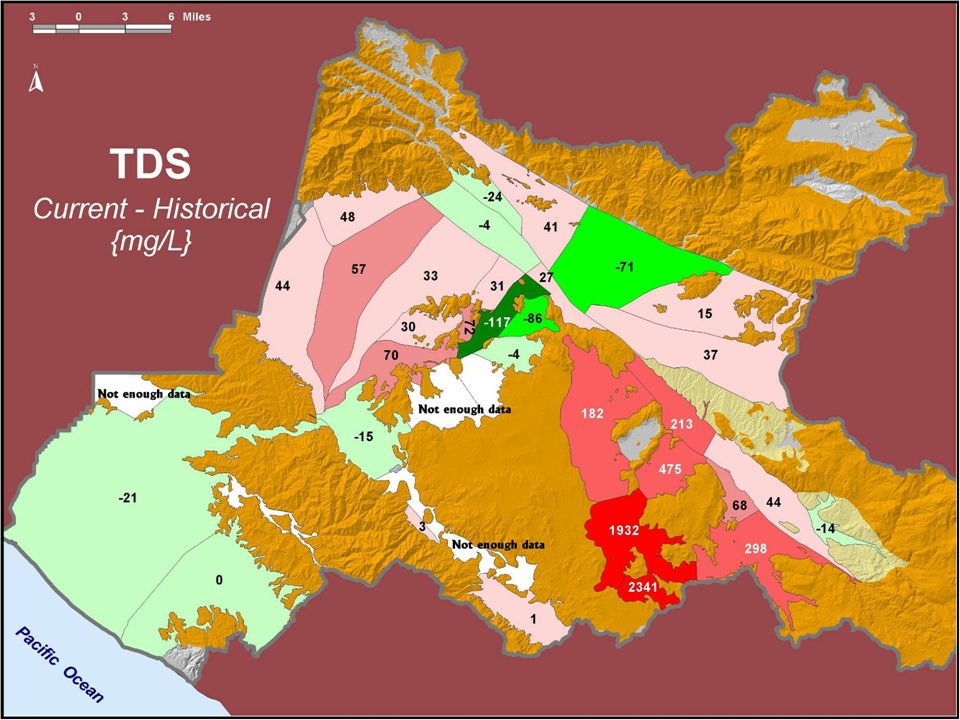
N/TDS Task Force Re-created objectives using 1972 20-year running average and evaluated current ambient quality, also with 20-year average Strong scientific basis in conformance with laws and policies Established antidegradation objectives (St. Bd. Res. 68-16) Compared current ambient quality to objectives to determine whether assimilative capacity exists
 Compared current ambient quality to objectives to determine whether assimilative capacity exists.")
15
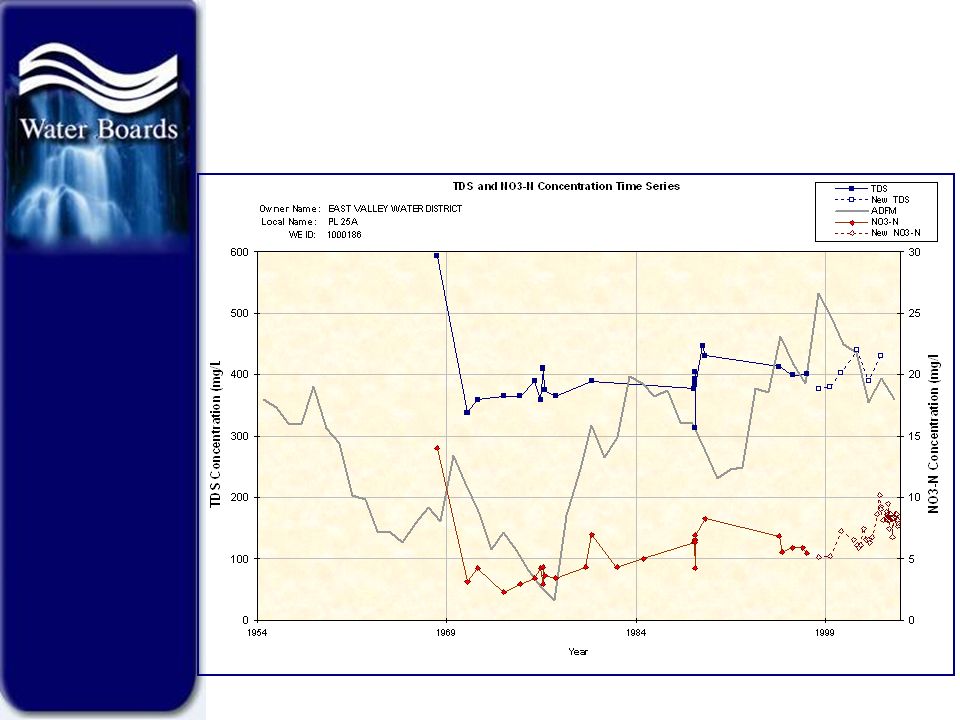
Develop Queries to Extract Data QA/QC Checks Develop TDS and NO 3 -N time histories Appropriate statistical tests for normality and outliers »Shapiro-Wilk test Standard methods tests »Anion-cation balance »Measured TDS vs. calculated TDS »Measured EC and ion sums »TDS to EC ratios Reject data if any test failed

17
Develop WQ Point Statistics at Each Well Each well must have at least three data points in separate years during the analysis period. TDS and Nitrate-nitrogen Computed statistics account for variability resulting from: sampling error analytical error hydrological/climatic events non-homogeneous hydrogeologic properties

18
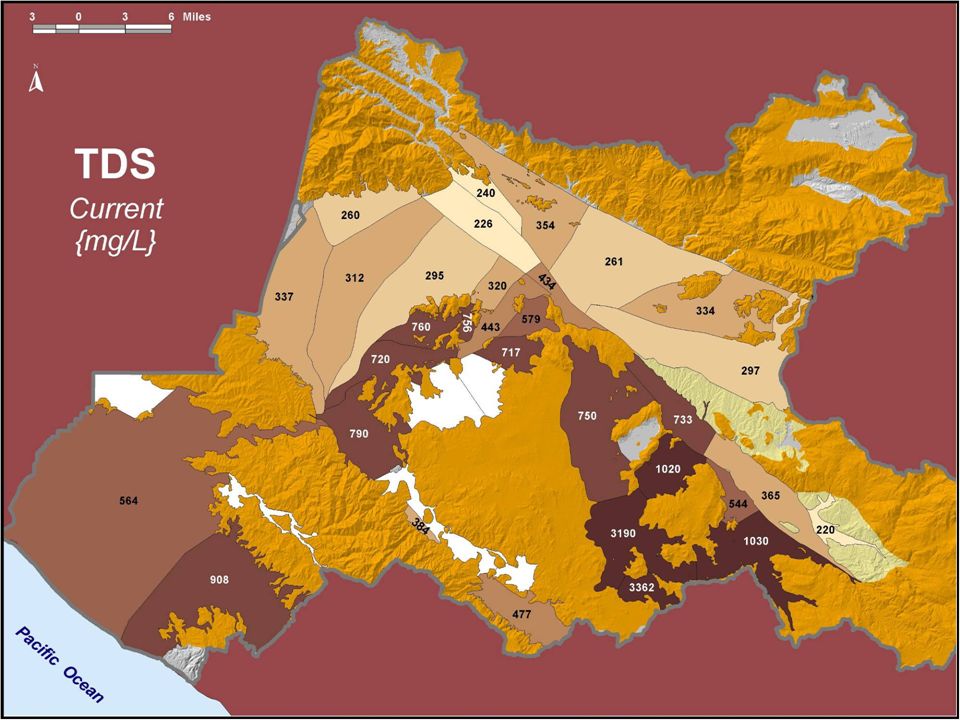
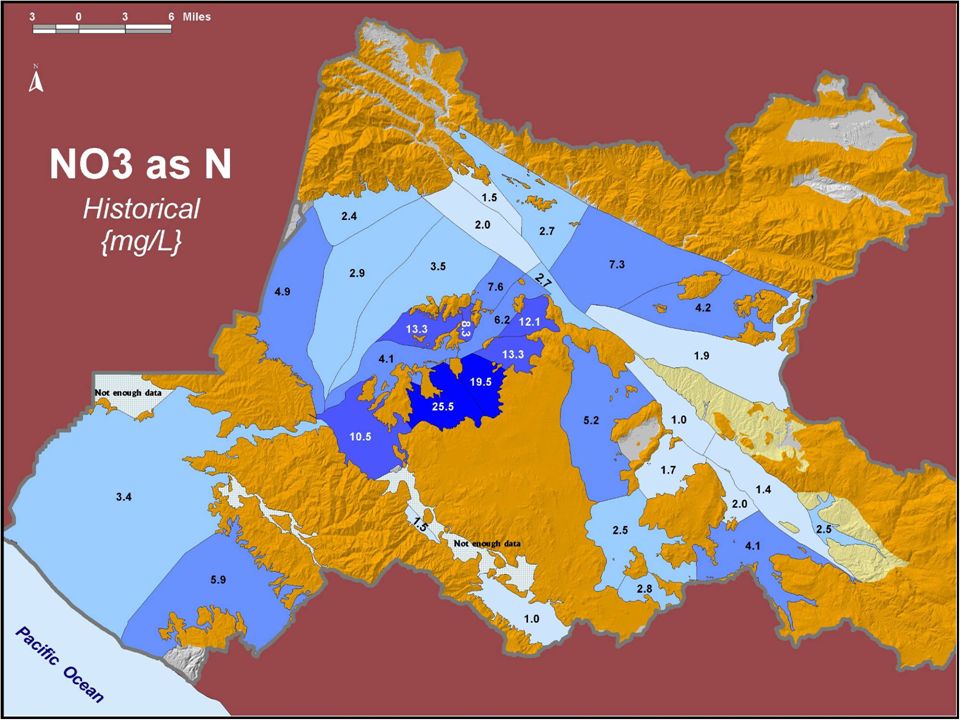
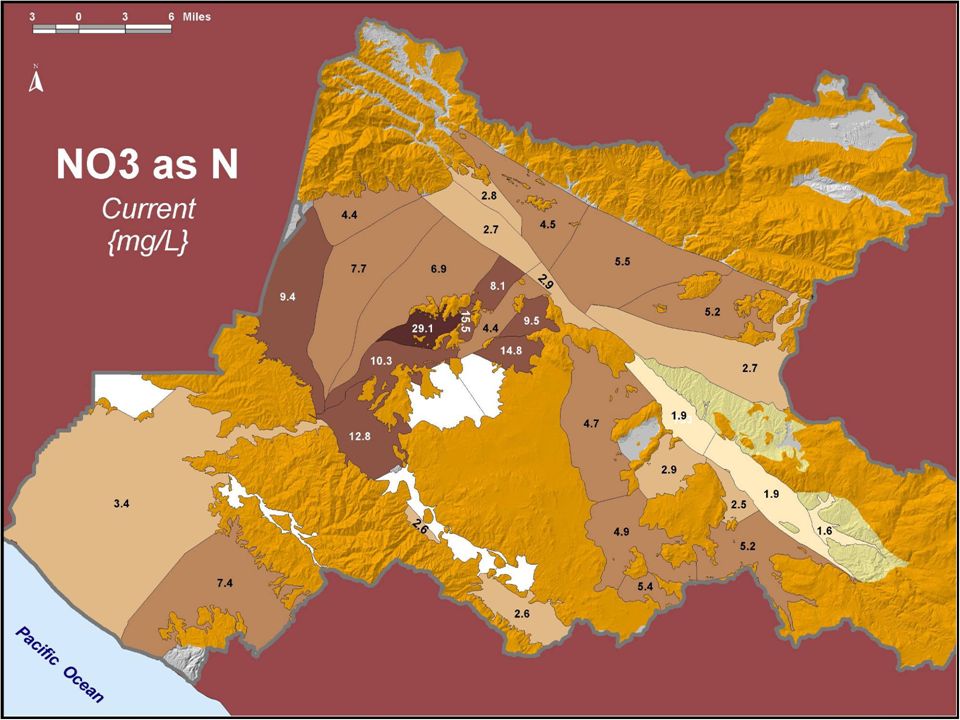
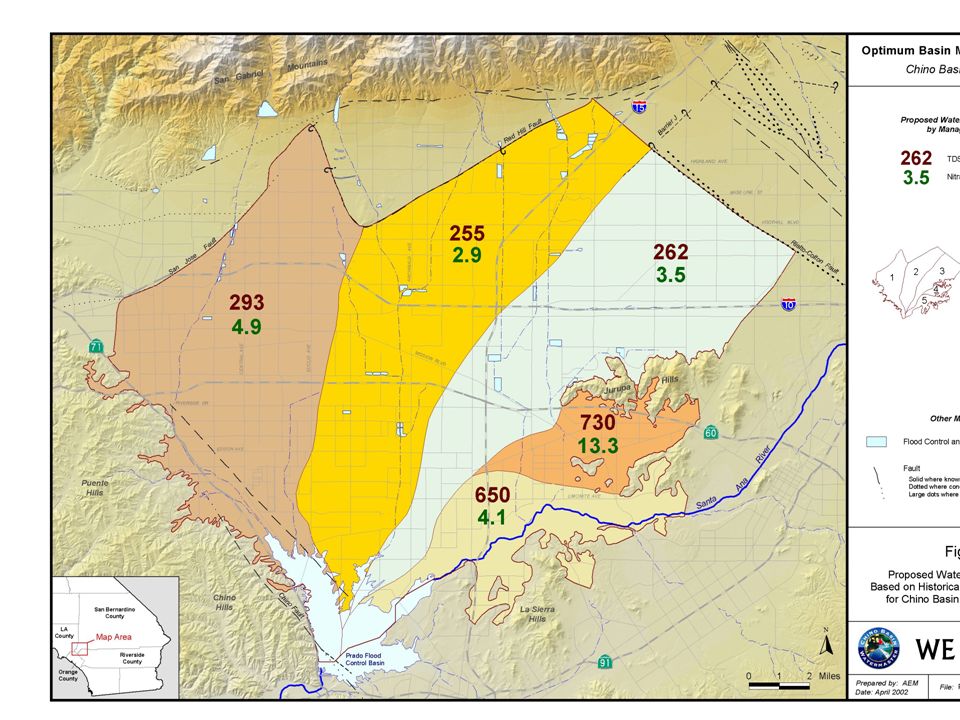
Develop procedures to calculate groundwater quality objectives Develop volume-weighted management zone estimates of TDS and nitrate concentrations Concentration MZ = Mass MZ / GW Volume MZ historical ambient conditions (1954 – 1973) –Objective setting period current ambient conditions (1978 – 1997) –Measure of compliance
 –Objective setting period current ambient conditions (1978 – 1997) –Measure of compliance")
19
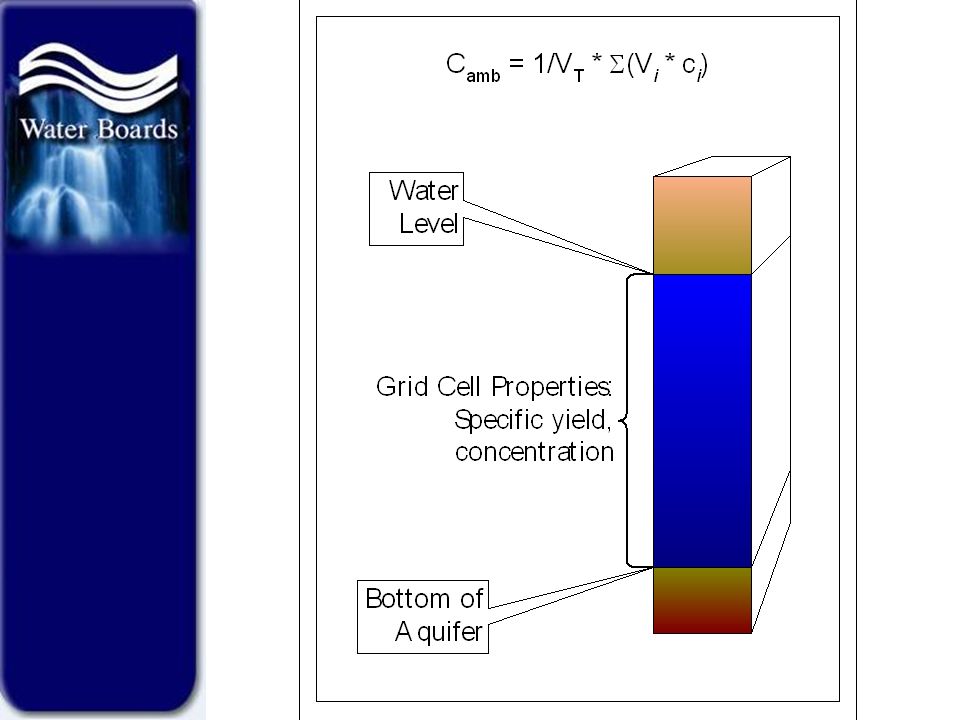
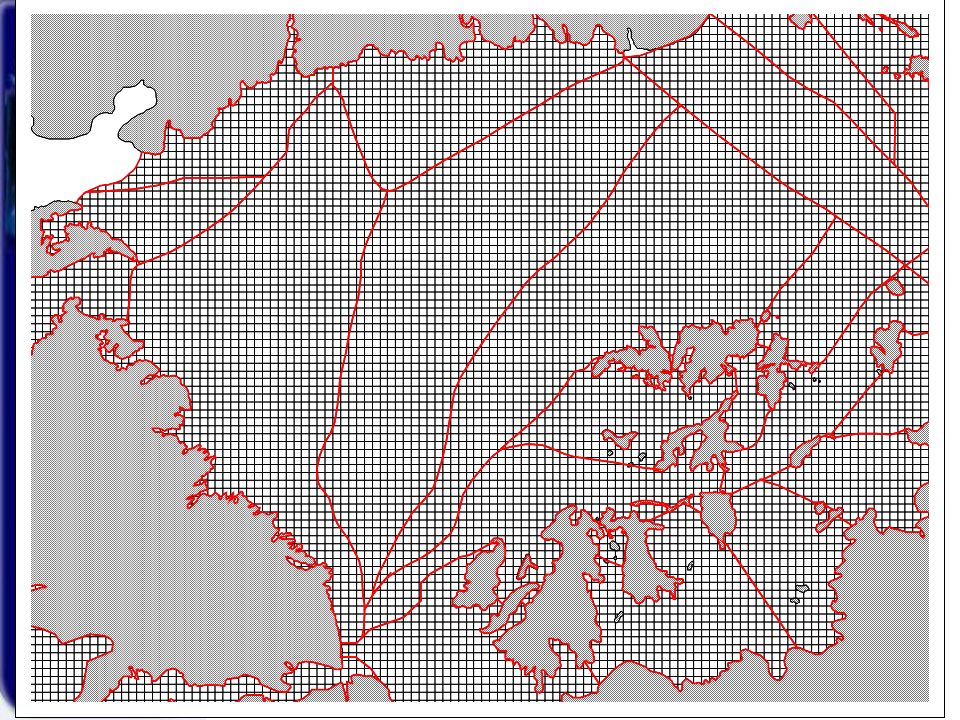
Compute Ambient Water Quality for Management Zones Create 400x400m grid across all MZs Populate each grid cell with: Water quality (TDS and Nitrate) Groundwater elevations Specific yield Bottom of the aquifer Aquifer geometry (layering) where appropriate
 Groundwater elevations Specific yield Bottom of the aquifer Aquifer geometry (layering) where appropriate")
20
Compute Ambient Water Quality for Management Zones Create 3-D GIS layers of: Water quality (TDS and Nitrate) Groundwater elevations Specific yield Bottom of the aquifer Aquifer geometry (layering) where appropriate 3 rd dimension is value of layer
 Groundwater elevations Specific yield Bottom of the aquifer Aquifer geometry (layering) where appropriate 3 rd dimension is value of layer")
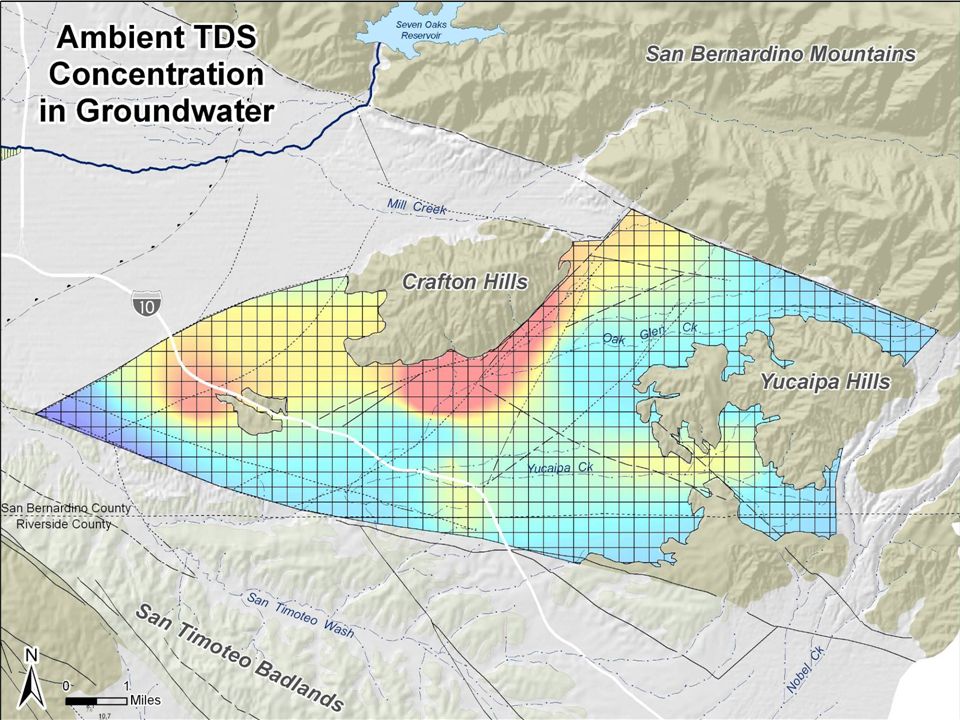
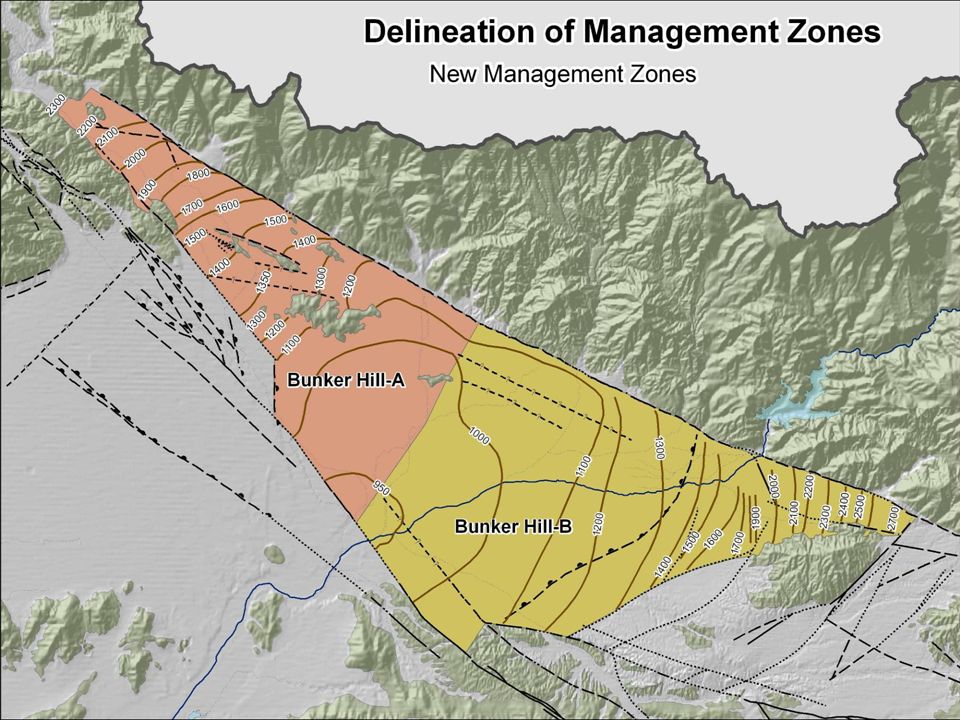
23
View Sample Map

35
Assimilative Capacity If assimilative capacity exists, then may discharge at quality in excess of objectives, if supported by antidegradation analysis (maximum benefit & support beneficial uses) –This reduces or exhausts assimilative capacity If no assimilative capacity, may not discharge at quality above objectives (Rancho Caballero decision)
 –This reduces or exhausts assimilative capacity If no assimilative capacity, may not discharge at quality above objectives (Rancho Caballero decision)")
36
Implications of the TIN/TDS Study Management Zones that lack assimilative capacity must have TDS and N0 3 discharge concentrations limited to a level at or below the proposed objectives. Effects: Planned recycled water recharge projects Potentially direct recycled water re-use Surface discharge in reaches that have GWR beneficial uses

37
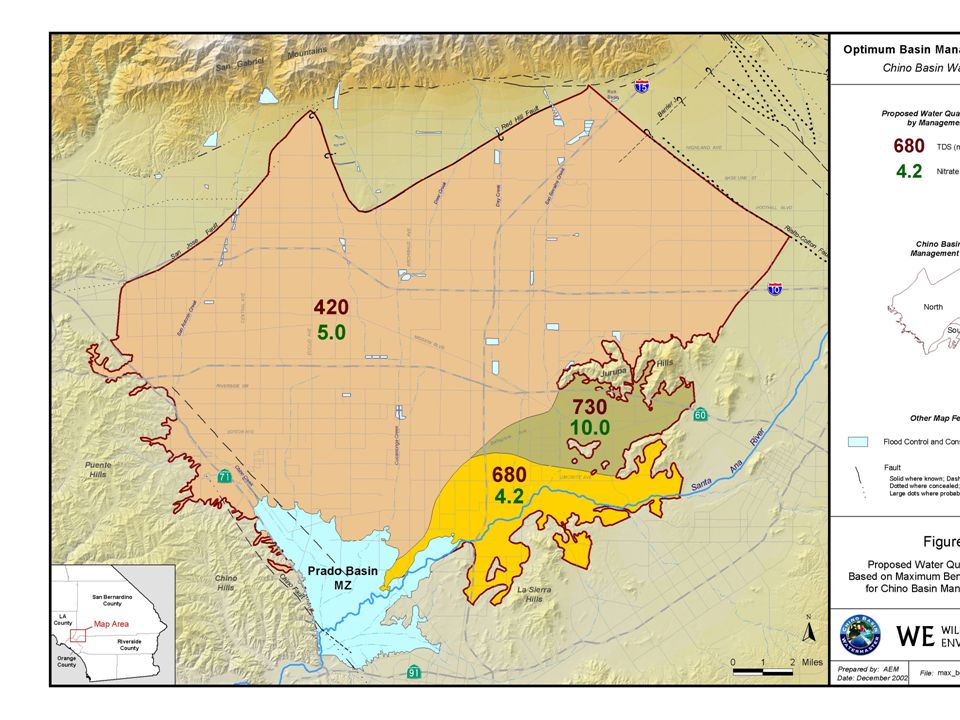
Max Ben Objectives Less stringent objectives would allow lowering of water quality, so must satisfy state’s antidegradation policy – Resolution 68-16 –1. Demonstrate that beneficial uses will continue to be protected –2. Water quality consistent with maximum benefit to the people of the state will be maintained

38
What are the Causes of TDS and N Degradation in the Chino Basin? Returns from use from agriculture and urban water users Recharge

42
Max Ben Demonstration Chino Basin Example –Integrated water supply plan Recycled water Enhanced stormwater capture Two (later, three) desalters Recharge excess low-TDS SPW Hydraulic Isolation Extensive monitoring proposal Water softener elimination program
 desalters Recharge excess low-TDS SPW Hydraulic Isolation Extensive monitoring proposal Water softener elimination program")
43
Chino Basin Max Ben Max benefit to people of state –Extraction and treatment of salt- contaminated groundwater –Protect downstream users from rising poor-quality groundwater –Less reliance on SPW for growth –Integrated water supply planning – Optimum Basin Management Program

44
Status of Basin Plan Amendment Approved by: RWQCB – January 2004 SWRCB – September 2004 OAL – December 2004 No negative comments through adoption process

45
All documents posted on web site www.waterboards.ca.gov/santaana

Similar presentations