Download presentation
Presentation is loading. Please wait.

1
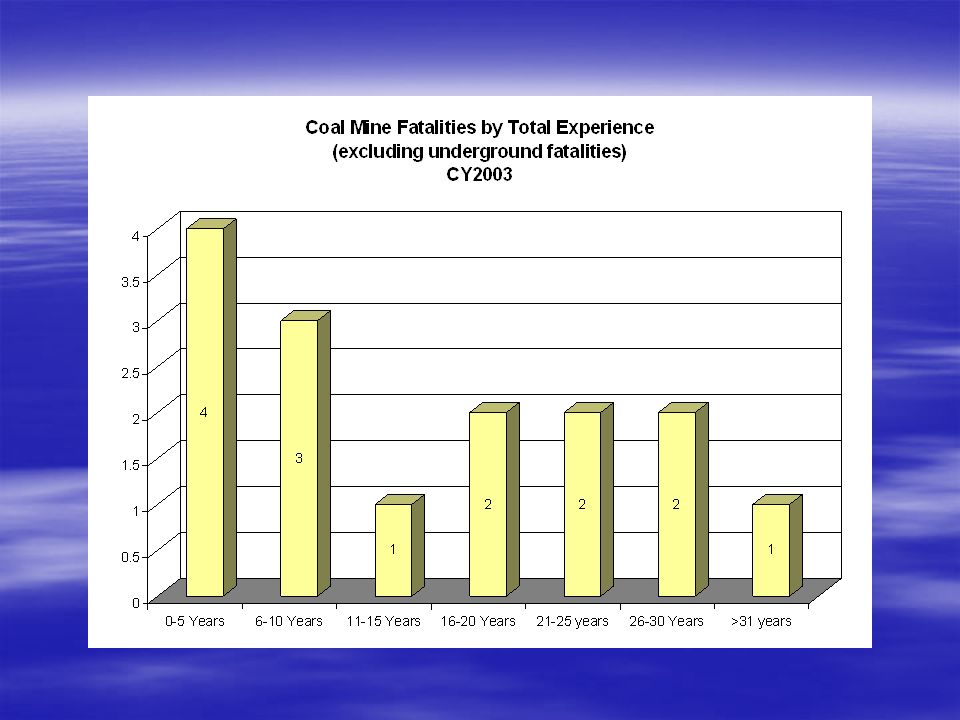
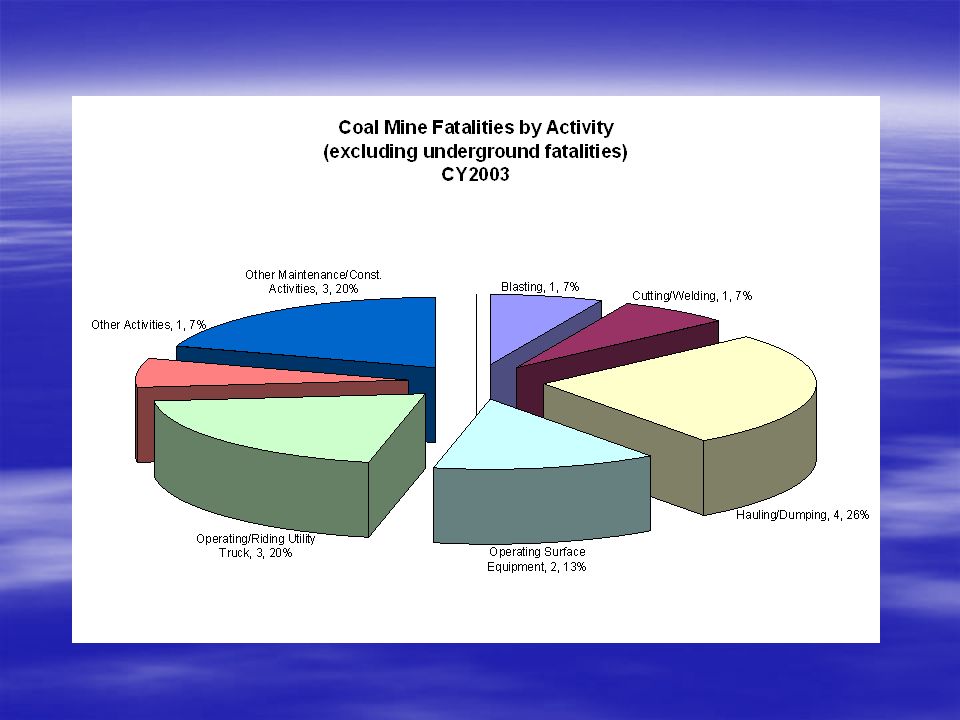
Calendar Year 2003 Surface - Coal Mine Fatal Accidents Fatalities by District Fatalities by Accident Classification Fatalities by Activity Fatalities by Number of Mine Employees Fatalities by Shift Fatalities by Day of Week Fatalities by Occupation Fatalities by Age Fatalities by Total Mining Experience Fatalities by Mine Experience Graphics include: Fatalities by Activity Experience

2
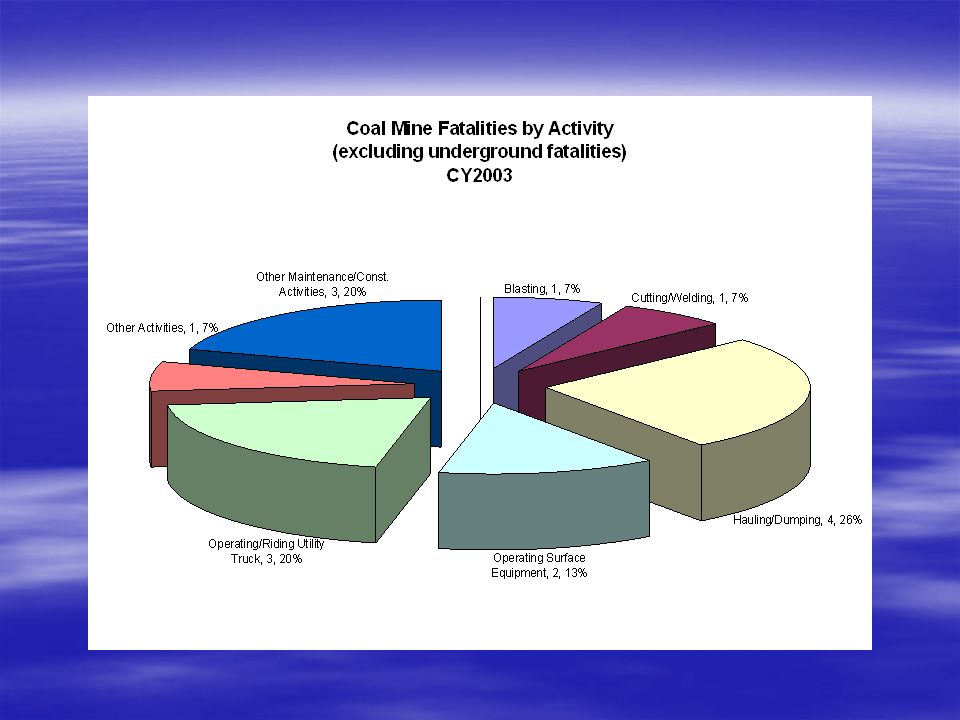
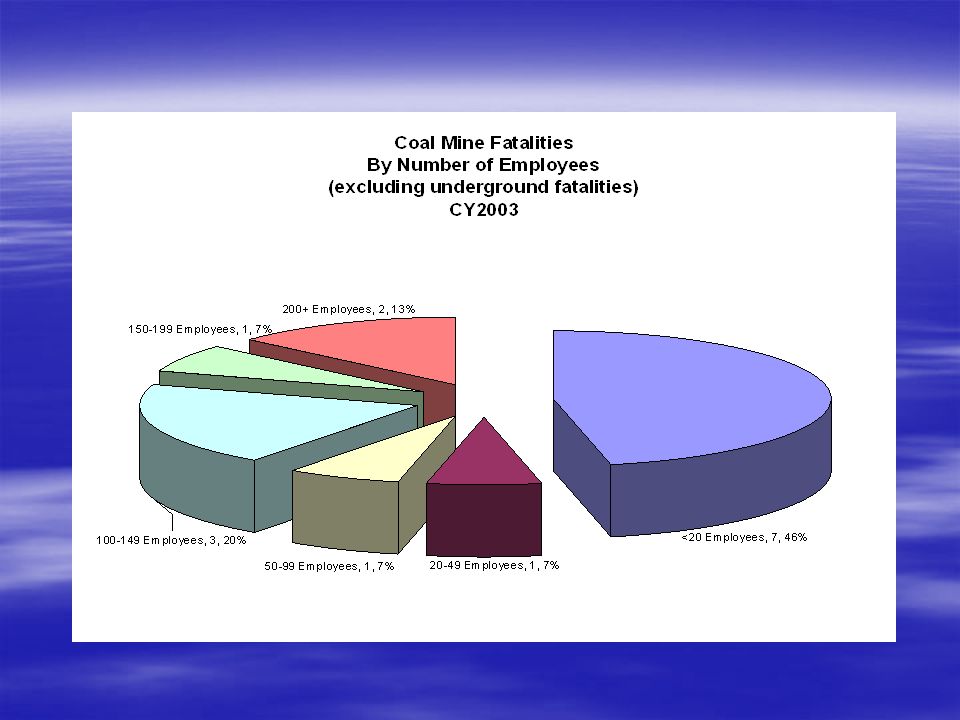
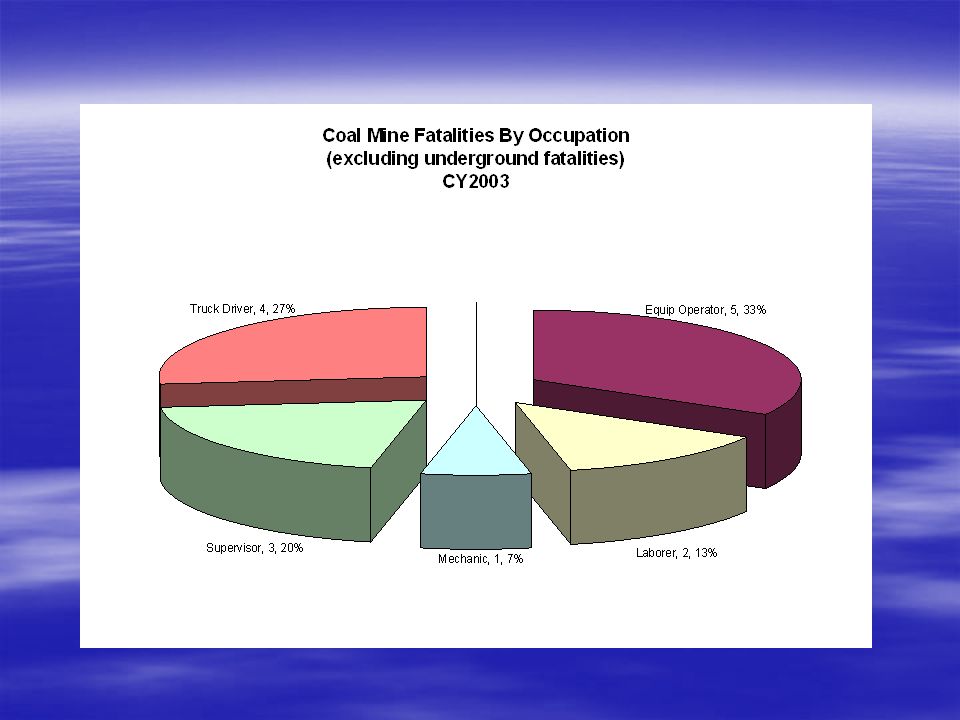
Synopsis of CY2003 Coal Mine Fatalities Surface Mines and Surface Areas of Underground Mines 15 fatalities have occurred on the surface at coal mines in CY03. 9 fatalities (59%) involved Operating haul trucks, utility vehicles or other surface mobile equipment. 4 fatalities (27%) involved equipment maintenance or cutting or welding. 53% of the fatal victims had more than 10 years total mining experience, but 27% had less than one year of experience at the mine where the accident occurred. 40% of the fatalities occurred at mines with more than 100 employees, 46% at mines with less than 20 employees. 80% of the fatal accidents occurred on day shift and 20% afternoon,. 3 (20%) of the fatal victims were supervisors.
 involved Operating haul trucks, utility vehicles or other surface mobile equipment. 4 fatalities (27%) involved equipment maintenance or cutting or welding. 53% of the fatal victims had more than 10 years total mining experience, but 27% had less than one year of experience at the mine where the accident occurred. 40% of the fatalities occurred at mines with more than 100 employees, 46% at mines with less than 20 employees. 80% of the fatal accidents occurred on day shift and 20% afternoon,. 3 (20%) of the fatal victims were supervisors..")
Similar presentations


 January 31, 2005 (Kentucky) Crushed Stone Operation Crushed Stone Operation.>")


