Download presentation
Presentation is loading. Please wait.

1
Adaptive Designs for Using Predictive Biomarkers in Phase III Clinical Trials Richard Simon, D.Sc. Chief, Biometric Research Branch National Cancer Institute http://linus.nci.nih.gov/brb

2
“Biomarkers” Surrogate endpoints –A measurement made before and after treatment to determine whether the treatment is working –Surrogate for clinical benefit Predictive classifiers –A measurement made before treatment to select good patient candidates for the treatment

3
Surrogate Endpoints It is extremely difficult to properly validate a biomarker as a surrogate for clinical outcome. It requires a series of randomized trials with both the candidate biomarker and clinical outcome measured

4
Biomarkers as Endpoints in Phase I and II Trials Biomarkers used as endpoints in phase I or phase II studies need not be validated as surrogates for clinical outcome The purposes of phase I and phase II trials are to determine whether to perform a phase III trial, and if so, with what dose, schedule, regimen and on what population of patients –Claims of treatment effectiveness should be based on phase III results

5
Unvalidated Surrogate Endpoints in Seamless Phase II/III Trials Randomized comparison of standard treatment ± new drug Size trial using phase III (e.g. survival) endpoint Perform interim futility analysis using phase II endpoint (e.g.biomarker or PFS) –If treatment vs control results are not significant for phase II endpoint, terminate accrual and do not claim any benefit of new treatment –If results are significant for intermediate endpoint, continue accrual and follow-up and do analysis of phase III endpoint at end of trial Interim analysis does not “consume” any of the significance level for the trial
 endpoint Perform interim futility analysis using phase II endpoint (e.g.biomarker or PFS) –If treatment vs control results are not significant for phase II endpoint, terminate accrual and do not claim any benefit of new treatment –If results are significant for intermediate endpoint, continue accrual and follow-up and do analysis of phase III endpoint at end of trial Interim analysis does not consume any of the significance level for the trial.")
6
Adaptive Phase I and II Trials Adaptiveness in phase I and II trials can help optimize the dose/schedule and patient population in order to develop the right pivotal trial Bayesian methods provide great flexibility for phase I and II trials –Subjective prior distributions can be appropriate

7
Adaptive Methods Have been around for a long time –PF Thall, R Simon, SS Ellenberg, (1989) “A two-stage design for choosing among several experimental treatments and a control in clinical trials”, Biometrika 75:303-310.
 A two-stage design for choosing among several experimental treatments and a control in clinical trials , Biometrika 75:")
8
Adaptive Methods Frequentist methods can be very adaptive –Sample size –Target population –Treatment arms The algorithm for adapting should be specified in the protocol In assessing statistical significance (or confidence intervals) the analysis should take into account the adaptiveness algorithm used The rejection region should be calibrated to limit the experiment-wise type I error (probability of making any false positive claim from a study) to 5%, taking into account the adaptiveness algorithm used
 the analysis should take into account the adaptiveness algorithm used The rejection region should be calibrated to limit the experiment-wise type I error (probability of making any false positive claim from a study) to 5%, taking into account the adaptiveness algorithm used")
9
Adaptive Methods With Bayesian methods all prior distributions must be specified in advance Bayesian inference usually does not control type I error Bayesian methods can control the type I error in adaptive trials if the algorithm for adaptiveness is specified in advance Bayesian methods are often problematic for phase III trials because there may be no prior distribution appropriate for all parties.

10
Predictive Biomarker Classifiers Many cancer treatments benefit only a small proportion of the patients to which they are administered Targeting treatment to the right patients can greatly improve the therapeutic ratio of benefit to adverse effects –Treated patients benefit –Treatment more cost-effective for society

11
Developmental Strategy (I) Develop a diagnostic classifier that identifies the patients likely to benefit from the new drug Develop a reproducible assay for the classifier Use the diagnostic to restrict eligibility to a prospectively planned evaluation of the new drug Demonstrate that the new drug is effective in the prospectively defined set of patients determined by the diagnostic
 Develop a diagnostic classifier that identifies the patients likely to benefit from the new drug Develop a reproducible assay for the classifier Use the diagnostic to restrict eligibility to a prospectively planned evaluation of the new drug Demonstrate that the new drug is effective in the prospectively defined set of patients determined by the diagnostic")
12
Using phase II data, develop predictor of response to new drug Develop Predictor of Response to New Drug Patient Predicted Responsive New Drug Control Patient Predicted Non-Responsive Off Study

13
Applicability of Design I Primarily for settings where the classifier is based on a single gene whose protein product is the target of the drug With substantial biological basis for the classifier, it will often be unacceptable ethically to expose classifier negative patients to the new drug It is inappropriate to expose classifier negative patients to a treatment for the purpose of showing that a treatment not expected to work for them actually doesn’t.

14
Evaluating the Efficiency of Strategy (I) Simon R and Maitnourim A. Evaluating the efficiency of targeted designs for randomized clinical trials. Clinical Cancer Research 10:6759-63, 2004; Correction 12:3229,2006 Maitnourim A and Simon R. On the efficiency of targeted clinical trials. Statistics in Medicine 24:329-339, 2005.

15
Relative efficiency depends on proportion of patients test positive, and effectiveness of drug (compared to control) for test negative patients When less than half of patients are test negative and the drug has little or no benefit for test negative patients, the targeted design requires dramatically fewer randomized patients. –May require fewer or more patients to be screened than randomized with untargeted design

16
Web Based Software for Comparing Sample Size Requirements http://linus.nci.nih.gov/brb/

17
Developmental Strategy (II) Develop Predictor of Response to New Rx Predicted Non- responsive to New Rx Predicted Responsive To New Rx Control New RXControl New RX
 Develop Predictor of Response to New Rx Predicted Non- responsive to New Rx Predicted Responsive To New Rx Control New RXControl New RX")
18
Developmental Strategy (II) Do not use the diagnostic to restrict eligibility, but to structure a prospective analysis plan. Compare the new drug to the control overall for all patients ignoring the classifier. –If p overall 0.04 claim effectiveness for the eligible population as a whole Otherwise perform a single subset analysis evaluating the new drug in the classifier + patients –If p subset 0.01 claim effectiveness for the classifier + patients.

19
This analysis strategy is designed to not penalize sponsors for having developed a classifier It provides sponsors with an incentive to develop genomic classifiers

20
Predictive Medicine not Correlative Science The purpose of the RCT is to evaluate the new treatment overall and for the pre-defined subset The purpose is not to re-evaluate the components of the classifier, or to modify or refine the classifier The purpose is not to demonstrate that repeating the classifier development process on independent data results in the same classifier

21
Developmental Strategy III Do not use the diagnostic to restrict eligibility, but to structure a prospective analysis plan. Compare the new drug to the control for classifier positive patients –If p + >0.05 make no claim of effectiveness –If p + 0.05 claim effectiveness for the classifier positive patients and Continue accrual of classifier negative patients and eventually test treatment effect at 0.05 level

22
Separate testing of treatment effect in positive and negative subsets If the drug is expected to be effective overall, design III will not be attractive as it requires commitment to a double sized clinical trial –The chance of a false negative in at least one subset is 19% –the potential value of being able to do a subset analysis may not be worth the cost of having to demonstrate effectiveness in both subsets separately for broad labeling

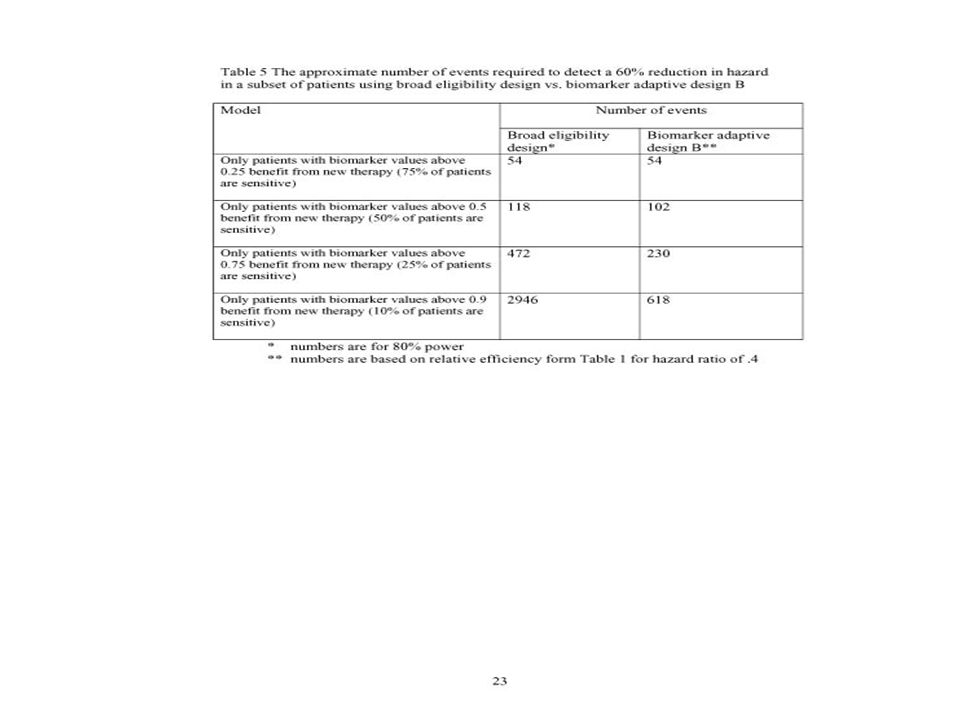
23
The Roadmap 1.Develop a completely specified genomic classifier of the patients likely to benefit from a new drug 2.Establish reproducibility of measurement of the classifier 3.Use the completely specified classifier to design and analyze a new clinical trial to evaluate effectiveness of the new treatment with a pre-defined analysis plan.

24
Guiding Principle The data used to develop the classifier must be distinct from the data used to test hypotheses about treatment effect in subsets determined by the classifier –Developmental studies are exploratory And not closely regulated by FDA FDA should not regulate classifier development –Studies on which treatment effectiveness claims are to be based should be definitive studies that test a treatment hypothesis in a patient population completely pre-specified by the classifier

25
Retrospective-Prospective Study Use archived samples from a non-targeted (negative) clinical trial to develop a binary classifier of a subset thought to benefit from treatment Develop a single binary classifier Develop an assay for that classifier and establish analytical validity of that assay Write a protocol for testing effectiveness of the new treatment compared to control in classifier positive patients in a separate randomized clinical trial –New targeted type (I) trial –Using archived specimens from a second previously conducted randomized clinical trial
 clinical trial to develop a binary classifier of a subset thought to benefit from treatment Develop a single binary classifier Develop an assay for that classifier and establish analytical validity of that assay Write a protocol for testing effectiveness of the new treatment compared to control in classifier positive patients in a separate randomized clinical trial –New targeted type (I) trial –Using archived specimens from a second previously conducted randomized clinical trial")
26
Development of Genomic Classifiers Single gene or protein based on knowledge of therapeutic target Single gene or protein based on evaluation of a set of candidate genes or assays Empirically determined based on genome- wide correlating gene expression to patient outcome after treatment

27
Development of Genomic Classifiers During phase II development or After failed phase III trial using archived specimens. Adaptively during early portion of phase III trial.

28
Adaptive Signature Design An adaptive design for generating and prospectively testing a gene expression signature for sensitive patients Boris Freidlin and Richard Simon Clinical Cancer Research 11:7872-8, 2005

29
Adaptive Signature Design End of Trial Analysis Compare E to C for all patients at significance level 0.04 –If overall H 0 is rejected, then claim effectiveness of E for eligible patients –Otherwise

30
Otherwise: –Using specimens from patients accrued during the first half of the trial, develop a binary classifier that predicts the subset of patients most likely to benefit from the new treatment E compared to control C –Compare E to C for patients accrued in second stage who are predicted responsive to E based on classifier Perform test at significance level 0.01 If H 0 is rejected, claim effectiveness of E for subset defined by classifier

31
Treatment effect restricted to subset. 10% of patients sensitive, 10 sensitivity genes, 10,000 genes, 400 patients. TestPower Overall.05 level test46.7 Overall.04 level test43.1 Sensitive subset.01 level test (performed only when overall.04 level test is negative) 42.2 Overall adaptive signature design85.3
 42.2 Overall adaptive signature design85.3.")
32
Overall treatment effect, no subset effect. 10,000 genes, 400 patients. TestPower Overall.05 level test74.2 Overall.04 level test70.9 Sensitive subset.01 level test1.0 Overall adaptive signature design70.9

33
Possible Modifications to Adaptive Signature Design Refine.04/.01 split to take correlation of tests into account If overall test is not significant at.04 level, develop binary classifier and continue accrual of classifier positive patients Application to selecting among a few candidate tests in rather than developing gene expression signature

34
Biomarker Adaptive Threshold Design Wenyu Jiang, Boris Freidlin & Richard Simon JNCI 99:1036-43, 2007 http://linus.nci.nih.gov/brb

35
Biomarker Adaptive Threshold Design Randomized pivotal trial comparing new treatment E to control C Survival or DFS endpoint Have identified a univariate biomarker index B thought to be predictive of patients likely to benefit from E relative to C Eligibility not restricted by biomarker No threshold for biomarker determined Biomarker value scaled to range (0,1)
")
36
Biomarker Adaptive Threshold Design (A) Compare E vs C overall using significance threshold of 0.04 –If significant, claim broad effectiveness of E If not significant, –Compare E vs C for patients with B > b Do this for each possible threshold value b Compute log likelihood ratio statistic S(b)for treatment versus control effectiveness in subset with B>b Find b* that maximizes S(b) Define T=S(b*) –Compute significance of T by permuting patients to E and C If significance level, adjusted for optimal threshold is < 0.01, then claim treatment effectiveness for subset Compute bootstrap confidence interval for optimal threshold b*
 Compare E vs C overall using significance threshold of 0.04 –If significant, claim broad effectiveness of E If not significant, –Compare E vs C for patients with B > b Do this for each possible threshold value b Compute log likelihood ratio statistic S(b)for treatment versus control effectiveness in subset with B>b Find b* that maximizes S(b) Define T=S(b*) –Compute significance of T by permuting patients to E and C If significance level, adjusted for optimal threshold is < 0.01, then claim treatment effectiveness for subset Compute bootstrap confidence interval for optimal threshold b*")
37
Biomarker Adaptive Threshold Design (A) Compute significance of maximized treatment difference by permuting labels of which treatments are assigned to which patients –Hold fixed the B values for each patient and the total number of patients in each treatment group –Re-analyze the permuted data, comparing treatments for subset with B>b for each b, computing S(b) and determining threshold b* with largest S(b) value T=S(b*) for permuted data Repeat for 10,000 permutations Count the proportion of random permutations that result in S(b*) values as large as S(b*) for the real data –That is p value adjusted for optimizing over threshold values –If significance level, adjusted for optimal threshold is < 0.01, then claim treatment effectiveness for subset –Compute bootstrap confidence interval for optimal threshold b*
 Compute significance of maximized treatment difference by permuting labels of which treatments are assigned to which patients –Hold fixed the B values for each patient and the total number of patients in each treatment group –Re-analyze the permuted data, comparing treatments for subset with B>b for each b, computing S(b) and determining threshold b* with largest S(b) value T=S(b*) for permuted data Repeat for 10,000 permutations Count the proportion of random permutations that result in S(b*) values as large as S(b*) for the real data –That is p value adjusted for optimizing over threshold values –If significance level, adjusted for optimal threshold is < 0.01, then claim treatment effectiveness for subset –Compute bootstrap confidence interval for optimal threshold b*")
38
Estimated Power of Broad Eligibility Design (n=386 events) vs Adaptive Design (n=412 events) 80% power for 30% hazard reduction ModelBroad Eligibility Design Biomarker Adaptive Design 40% reduction in 50% of patients (20% overall reduction).70.78 60% reduction in 25% of patients (20% overall reduction).65.91 79% reduction in 10% of patients (14% overall reduction).35.93
 vs Adaptive Design (n=412 events) 80% power for 30% hazard reduction ModelBroad Eligibility Design Biomarker Adaptive Design 40% reduction in 50% of patients (20% overall reduction) % reduction in 25% of patients (20% overall reduction) % reduction in 10% of patients (14% overall reduction).35.93")
39
Procedure B S(b)=log likelihood ratio statistic for treatment versus control comparison in subset of patients with B b Compute S(b) for all possible threshold values Determine b* value for which S(b) is maximum T=max{S(0)+R, S(b*)} Compute null distribution of T by permuting treatment labels –Permute the labels of which patients are in which treatment group holding fixed the number of patients in each treatment group and the B value for each patient –Re-analyze the data Compare treatment to control for each subset of patients with B b for all cutpoints b Compute T for the permuted data –Repeat for 10,000 permutations
=log likelihood ratio statistic for treatment versus control comparison in subset of patients with B b Compute S(b) for all possible threshold values Determine b* value for which S(b) is maximum T=max{S(0)+R, S(b*)} Compute null distribution of T by permuting treatment labels –Permute the labels of which patients are in which treatment group holding fixed the number of patients in each treatment group and the B value for each patient –Re-analyze the data Compare treatment to control for each subset of patients with B b for all cutpoints b Compute T for the permuted data –Repeat for 10,000 permutations")
40
Procedure B If the data value of T is significant at 0.05 level using the permutation null distribution of T, then reject null hypothesis that E is ineffective Compute point and interval estimates of the threshold b

Similar presentations


 How.>")


 Design. Prospective Co-Development of Drugs and Companion Diagnostics 1. Develop a completely specified genomic classifier of the.>")


