Download presentation
Presentation is loading. Please wait.

1
METHODS

2
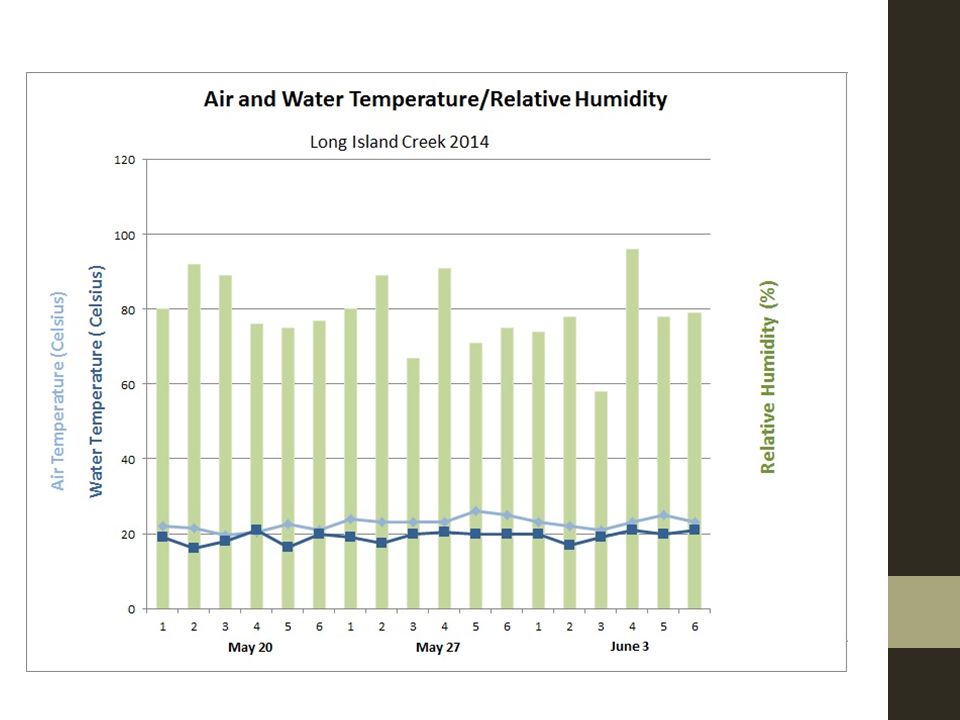
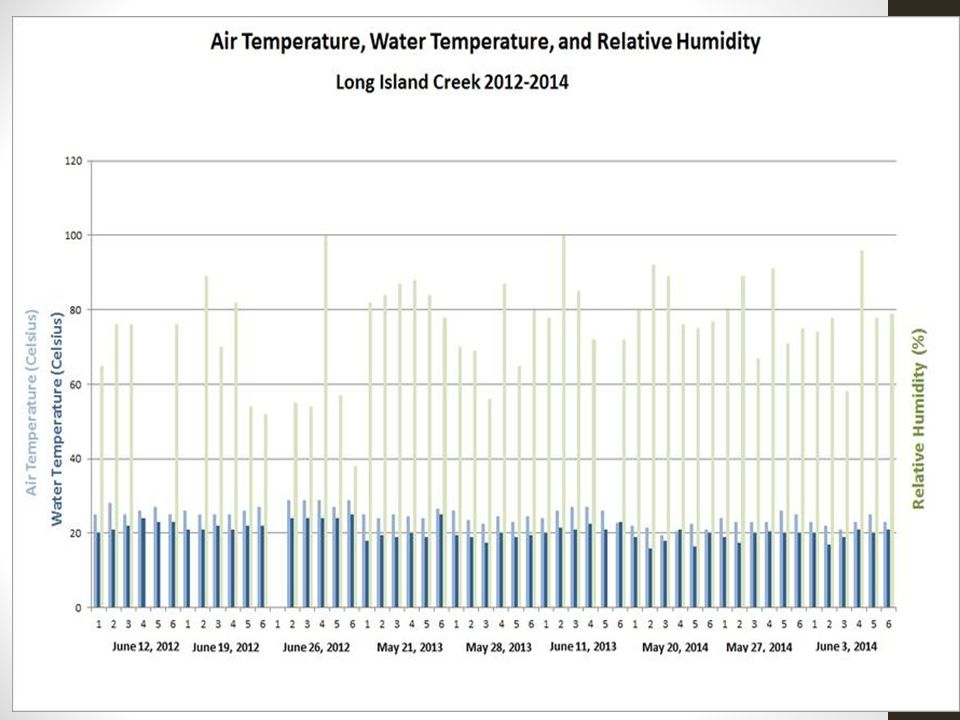
Physical Methods Steam Profile Discharge Air Temperature Water Temperature Relative Humidity

3
Chemical Methods Dissolved Oxygen pH Conductivity Nitrate-Nitrogen Phosphate Image Source: Colemanpalmer.com

4
Bacterial Methods E. coli

5
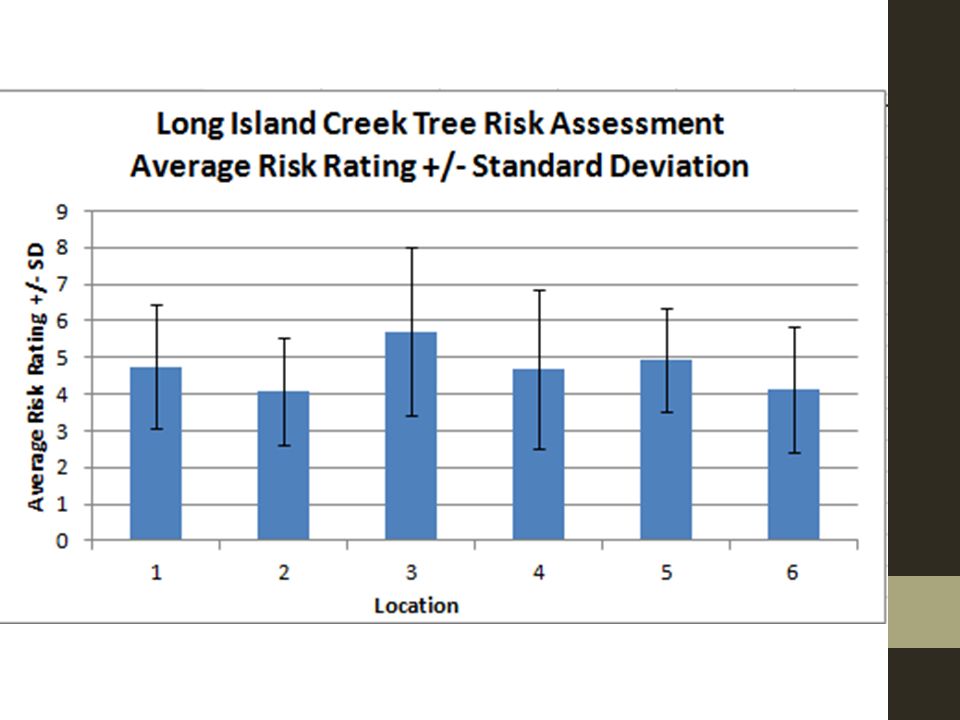
USDA Tree Risk Assessment Defect Codes Probability of Failure Risk Rating

6
Watershed Assessment

7
Tree Coverage NAIP Imagery Digitized QA/QC Photo Source: news.uga.edu

8
Results

10
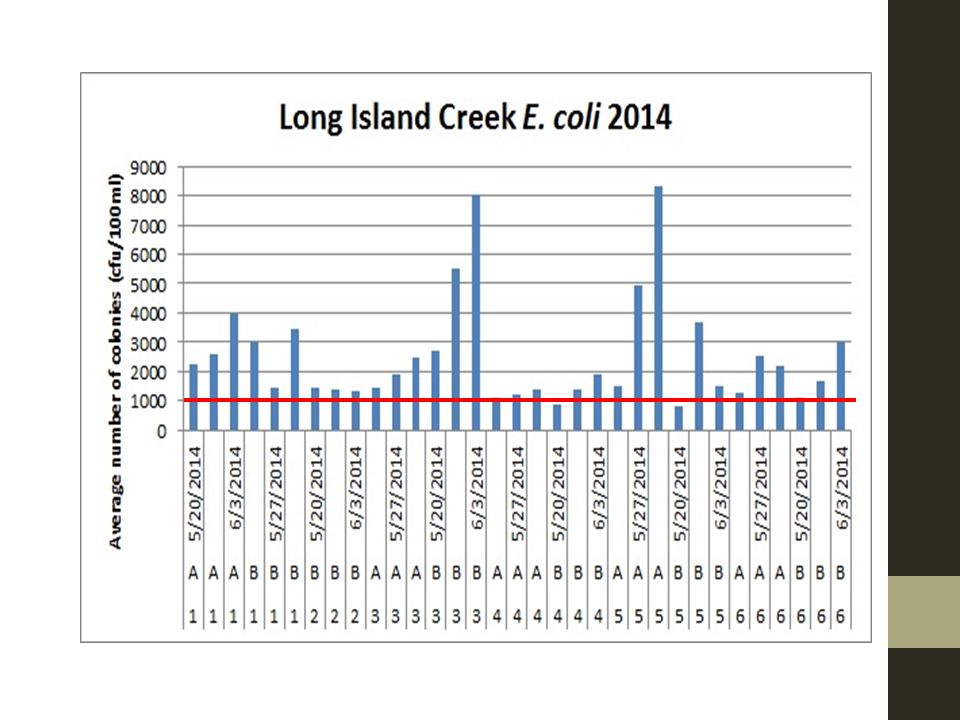
Location 2A/2B counted TNTC on 5/22 and 5/29 Location 4A also counted TNTC on 5/29

23
Long Island Creek Phosphate Sample SitesAverage (mg/L) 1A0 1B0 2A0 2B0.03 3A0 3B0 4A0 4B0 5A0.08 5B0 6A0 6B0
 1A0 1B0 2A0 2B0.03 3A0 3B0 4A0 4B0 5A0.08 5B0 6A0 6B0")
24
Marsh Creek Phosphate Sample SitesAverage (mg/L) 1A0 1B0 2A0.25 2B1.21 3A0 3B0 4A0 4B0 5A0 5B0 6A0 6B0.33
 1A0 1B0 2A0.25 2B1.21 3A0 3B0 4A0 4B0 5A0 5B0 6A0 6B0.33")
25
Tree Canopy Coverage Trees have higher albedo than urban landscape Prevent ‘heat island’ effect Evaluate rate of urban expansion

27
Long Island Creek Coverage: 60.311% Marsh Creek Coverage: 48.97% Average Coverage: 55.28%

28
Long Island Creek Conclusion E. Coli Levels coliform have increased since 2012. Most locations had consistent coliform levels that exceeded state standard of 1000 (cfu/100ml)
.")
29
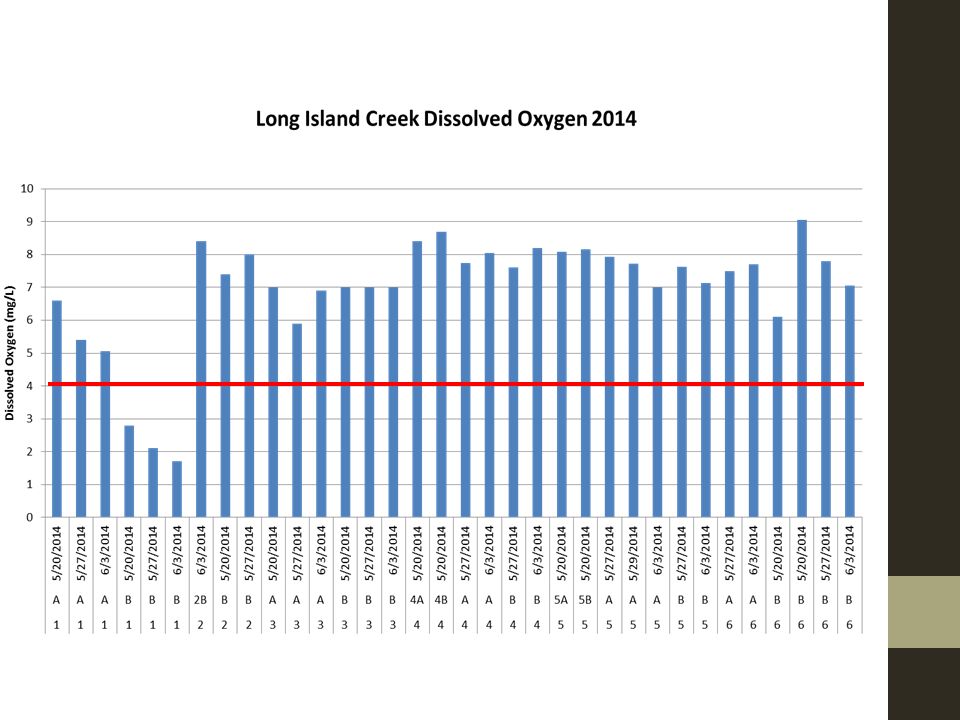
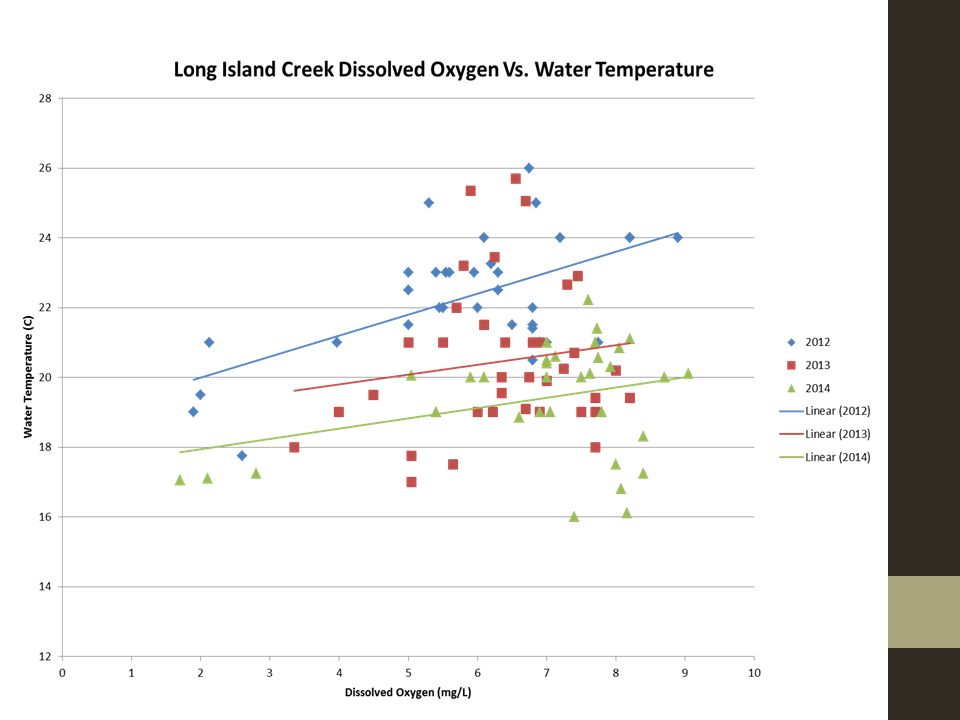
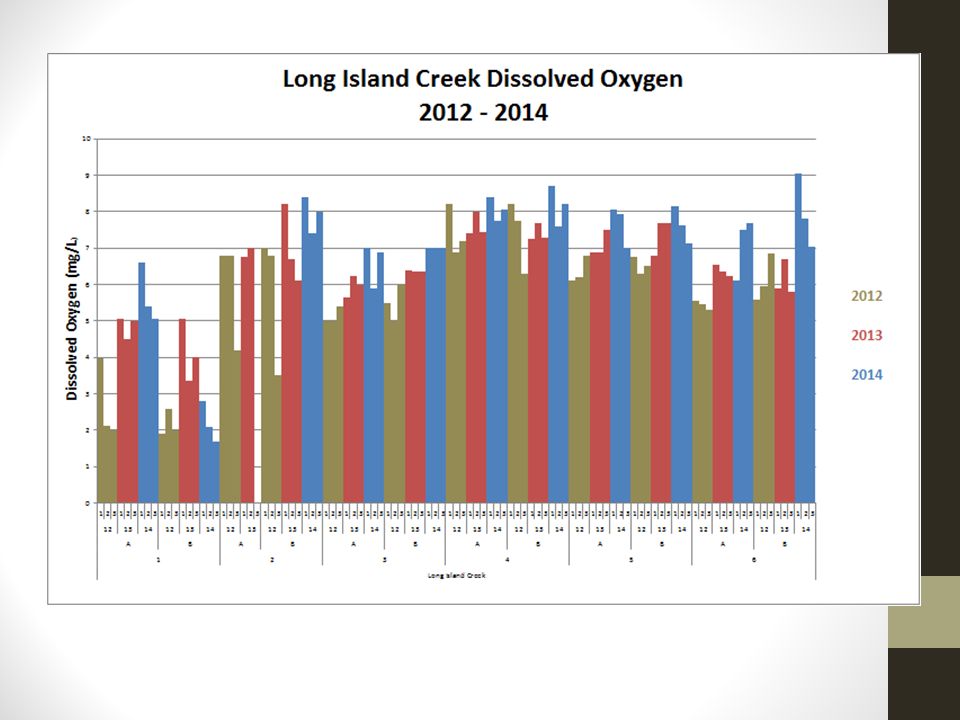
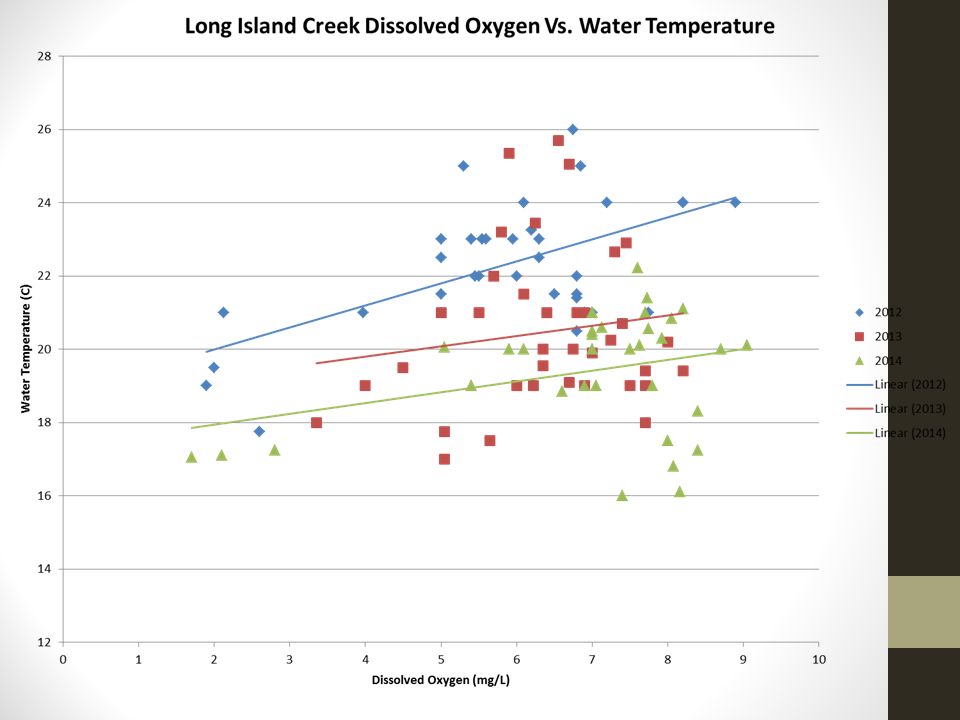
Long Island Creek Conclusion Dissolved Oxygen Dissolved Oxygen levels were consistently above the state minimum of 4 mg/L Overall dissolved oxygen levels were up from Previous years except for site 1b There water temperature is not the only factor that influences dissolved oxygen

30
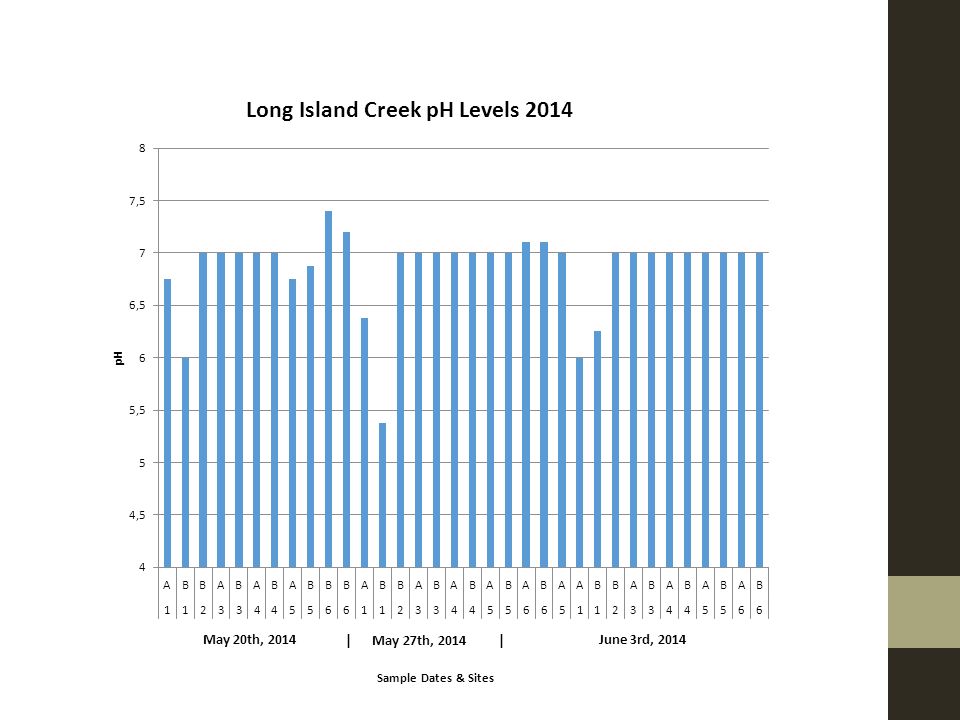
Long Island Creek Conclusion pH pH was consistently within the state standard range of 6.8 – 8.5 In 2014 Long Island Creek continued the trend from 2013 of becoming less acidic Headwaters were more acidic

31
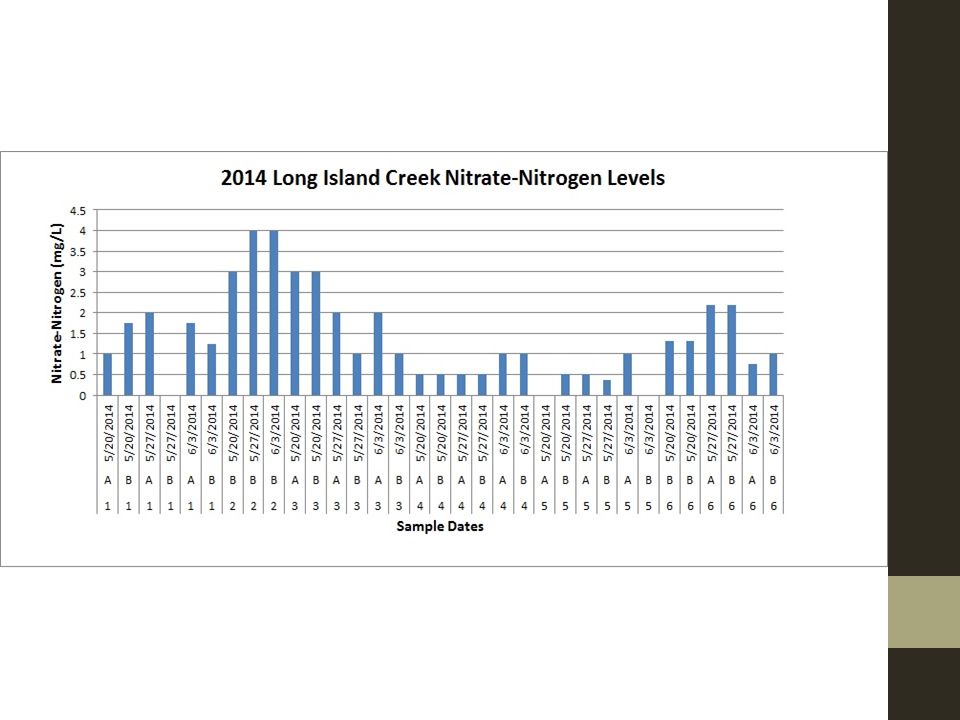
Long Island Creek Conclusion Nitrates Nitrates levels were below the state standards of 10mg/L Nitrates are reasonably lower than the 2013 results Drastic decrease in nitrate levels at site 2B

32
Long Island Creek Conclusion Phosphates Phosphates levels were all below the state standard Phosphate levels were too low to be cause for concern over the past three years.

33
Marsh Creek Conclusion E. coli E. coli levels were high enough to require serious concern Overall coliform levels are less than 2013 but still much higher than 2012 and also exceed the state standard of 1000 cfu/100ml

34
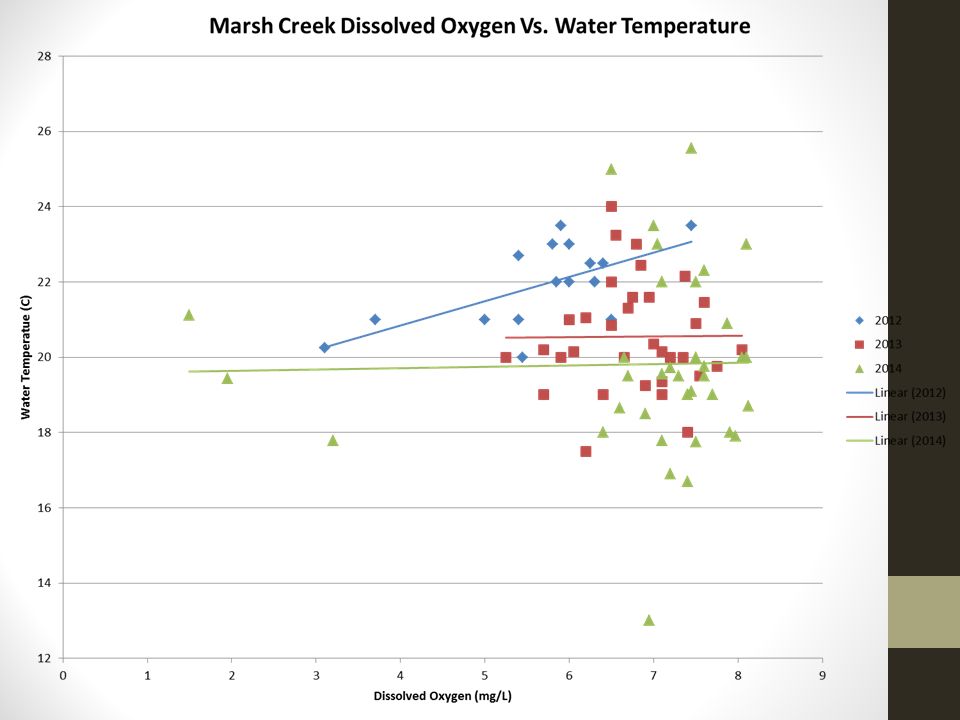
Marsh Creek Conclusion Dissolved Oxygen Dissolved Oxygen levels were consistently above the state minimum of 4 mg/L Overall Dissolved oxygen has increased with the exception of site 4a Factors other than temperature are affected dissolved oxygen levels

35
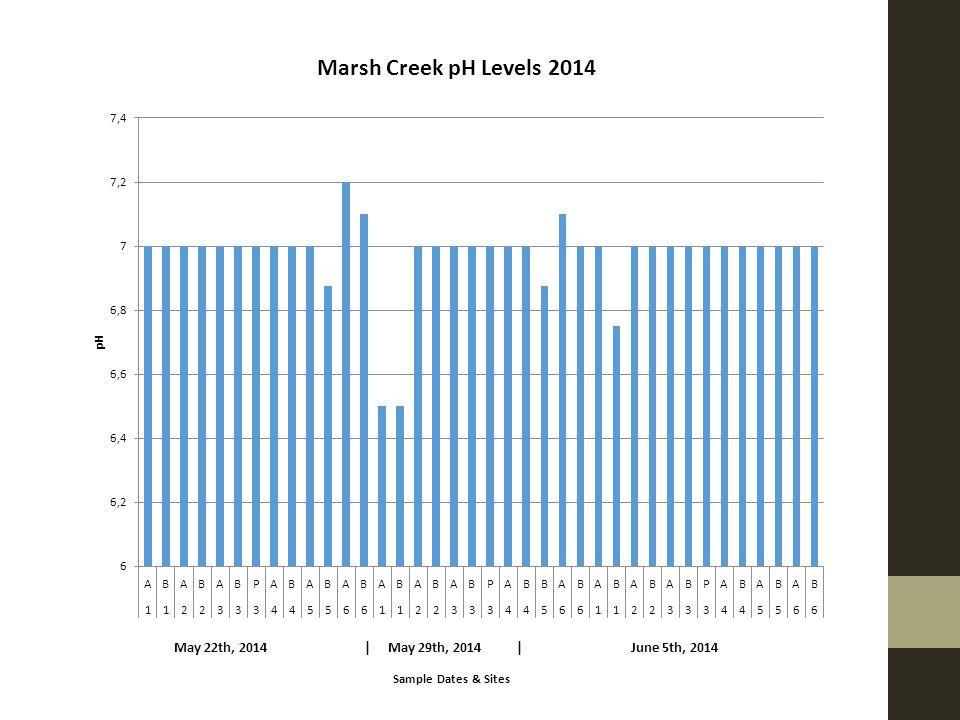
Marsh Creek Conclusion pH pH was consistently within the state standard range of 6.8 – 8.5 Marsh Creek continued to become less acidic 2014.

36
Marsh Creek Conclusion Nitrate-Nitrogen Nitrates levels were below the state standards of 10mg/L Most of the test results showed a positive change from 2013 High test results were shown for site 6a and 6b as well as site 1a on one test date

37
Marsh Creek Conclusion Phosphates 3 separate sites were above the the state standard of 0.1mg/L Phosphate have levels have been to low to be cause for concern between 2012 and 2014

38
Stream Bank Restoration Avondale Estates, Decatur 1 st order tributary of Cobbs Creek Under the supervision of Jack White, and Harold Harbert of GA Dept. of Natural Resources

39
Issues & Concerns Water channel created due to storm water run-off pipe located at the headwaters of the tributary. Extreme undercutting, leaving what was once relatively healthy trees with exposed roots.

40
Goals & Methods Goal: to slow the movement of water within the channel while diverting the direction of flow Logs were placed in a zig-zag formation within the water channel. Coconut netting staked in place near eroded hillsides to slow down water flowing into the scour pit

41
Stream Restoration

42
Results Stream Restoration: Results

43
A B A B Marsh Creek Outliers Highest E.coli : 4B, 5A & 5B, 6A & 6B Out of Range Dissolved Oxygen: 4A Phosphates: 2A & 2B, 6B

44
A B B B A Long Island Creek Outliers Highest E.coli : 3B & 5A Out of Range Dissolved Oxygen: 1B Phosphates: 2B, 5A

45
Condition of Watersheds Conclusion E.Coli levels are above the state standard and are increasing annually Nitrogen Levels are declining Dissolved oxygen levels are increasing The overall condition of the watershed is mixed

46
Questions

48
APPENDIX Trends for the years 2012-2014 to follow

Similar presentations


 Depends on…>")


>")


 Temperature ( °C )Average ( °C ) 114.9 °C 14.48 °C 215.5 °C 314.3 °C 414.2 °C 513.5 °C According to.>")


 Alkalinity: 122.3 ppm (also high due to limestone.>")
