Download presentation
Presentation is loading. Please wait.

1
Mad Day Trader Bill Davis Webinar – September 2, 2015

2
I want to begin today’s webinar with a few comments about trade execution and trade selection. These comments are based on emails I received from members. So, you may have the same questions too.

3
First comment was why did I recommend a covered call on CIEN instead of selling naked puts?

4
I will NOT recommend selling naked puts because it does require a higher level of option approval and there are some members who are not approved this strategy.

5
Having said, a covered call is a bullish strategy and has the same risk profile as selling naked puts. Personally, I find nothing wrong with selling naked puts and do it myself.

6
I will caution you to ONLY sell naked puts based on the number of shares you would own. Where people get into trouble is they sell an outsized position. If you want to own 400 shares, sell 4 puts.

7
Another bullish strategy is a Put Credit Spread. In this strategy, you sell a higher strike put and buy a lower strike put.

8
The point here is that you have options in terms of the strategy to use. You can choose the strategy you prefer.

9
The next comment I want to address is trade execution. Let’s say you open an alert a few hours later or the next day and the price has moved.

10
Let’s say the stock price and the option price has moved since the alert was issued.

11
If I suggest a covered call on a stock with weekly options, you could consider selling a different strike. I am assessing the return based on the prices when the alert is issued.

12
If the stock and the option prices have moved, you need to assess the risk to reward and decide if the trade is still worth putting on.

13
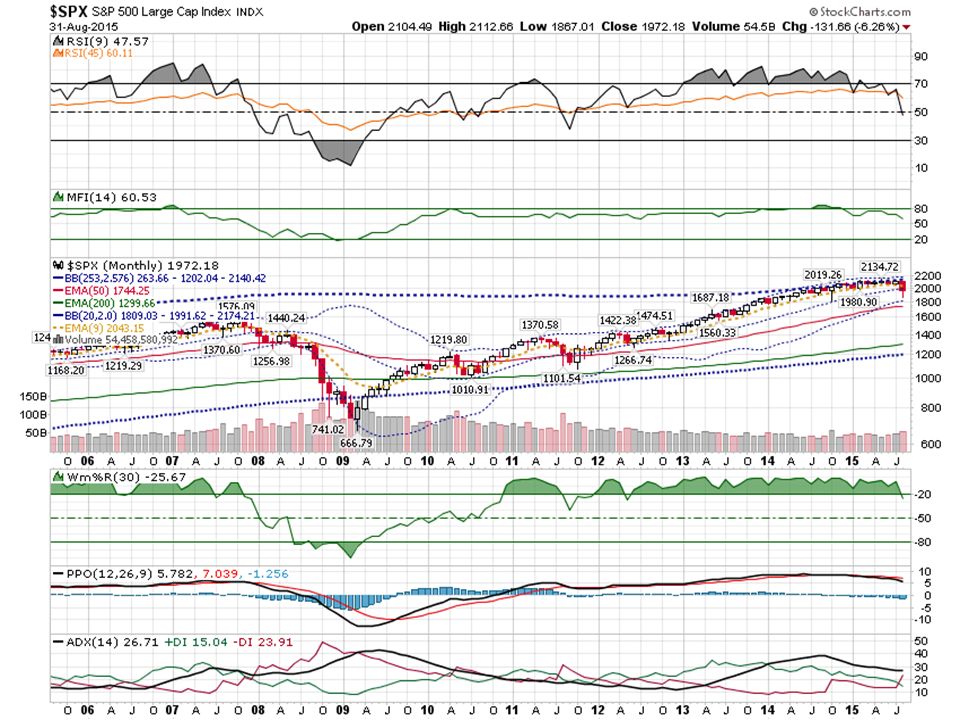
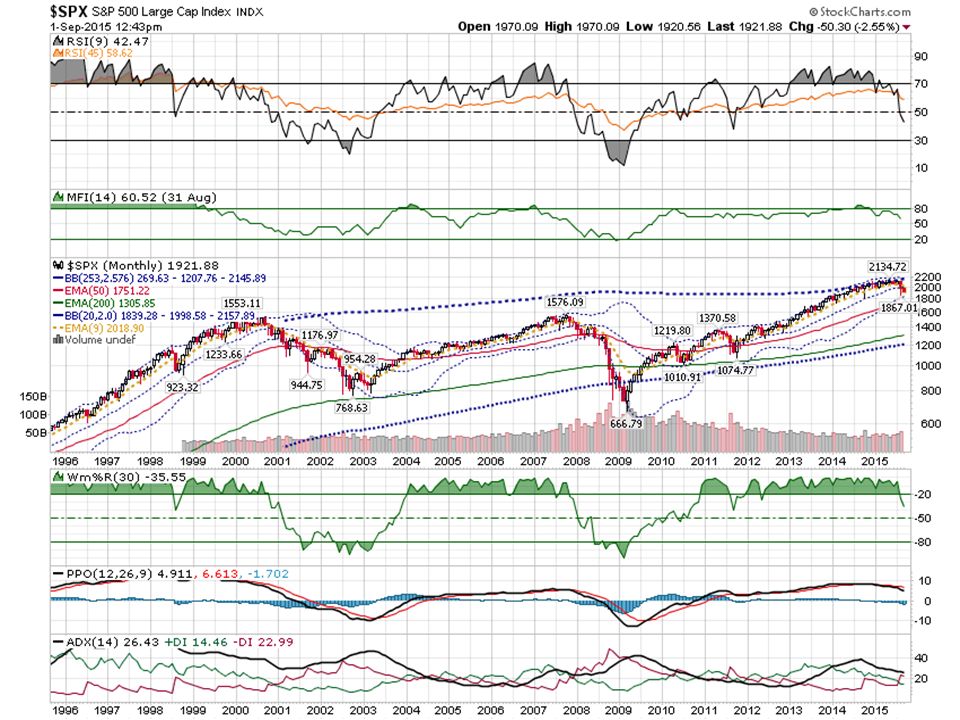
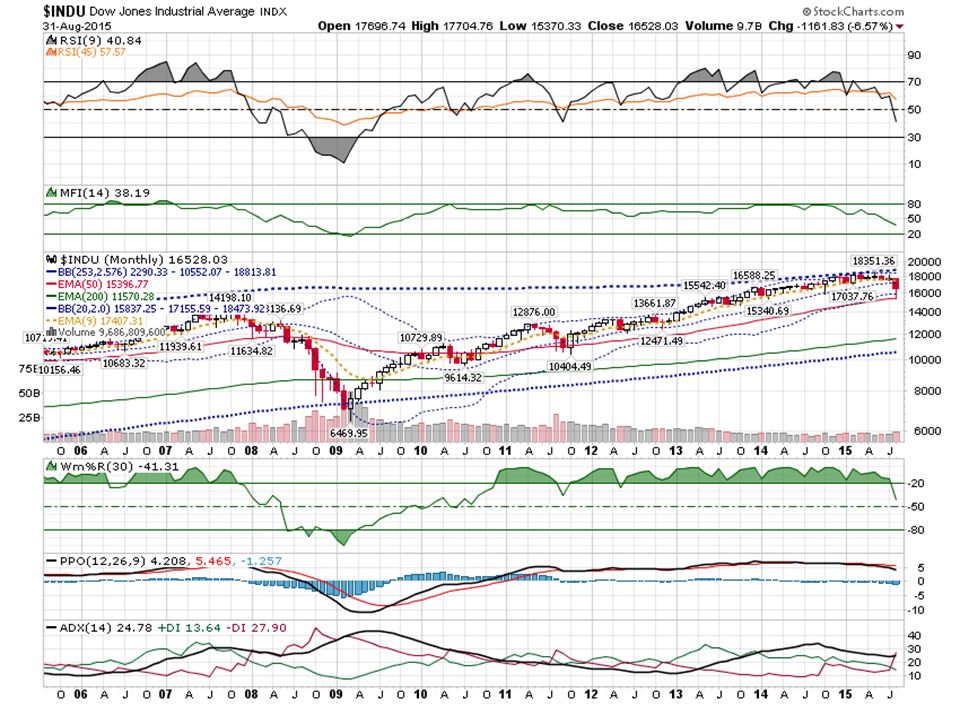
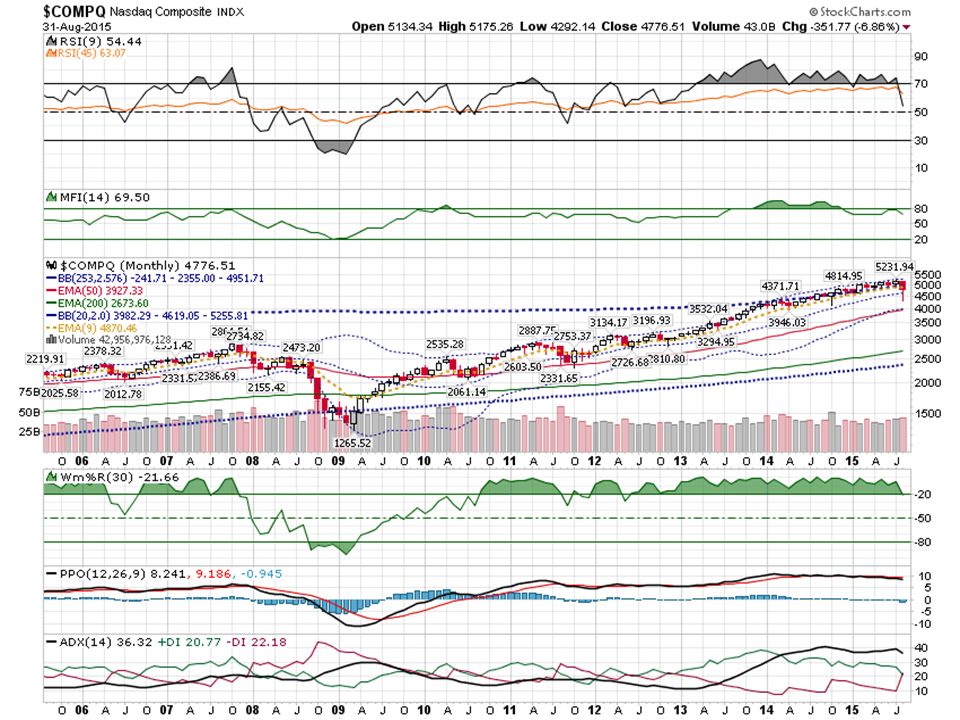
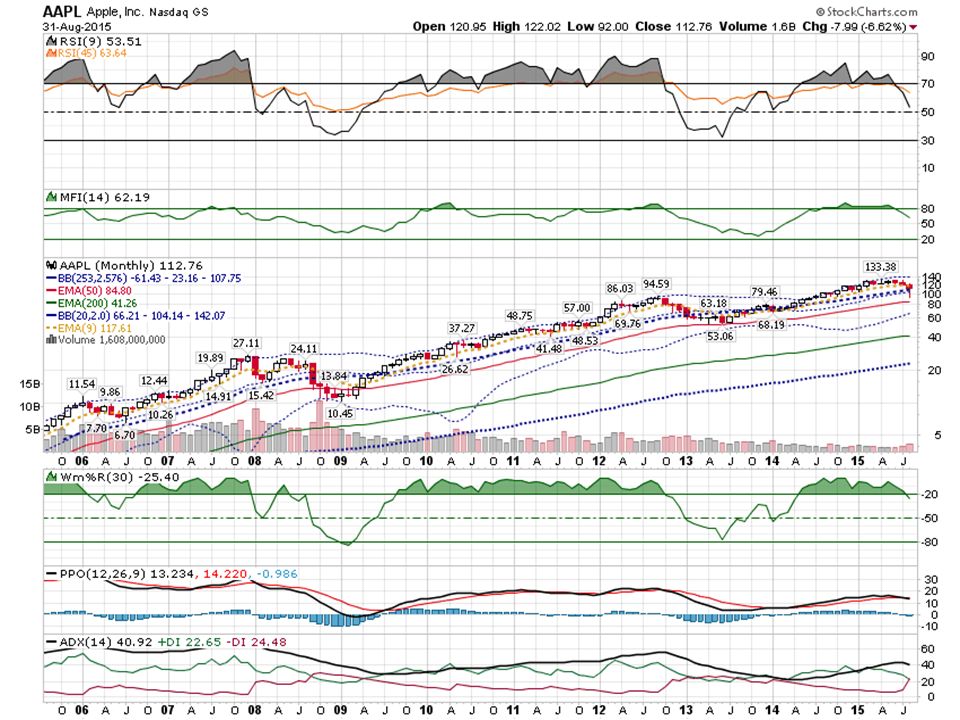
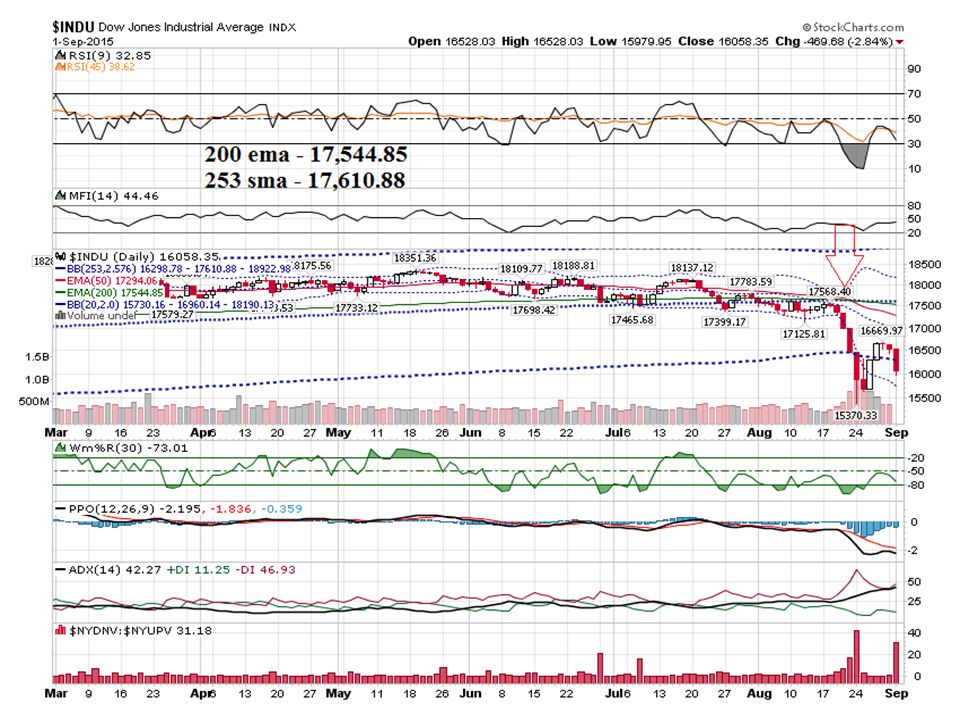
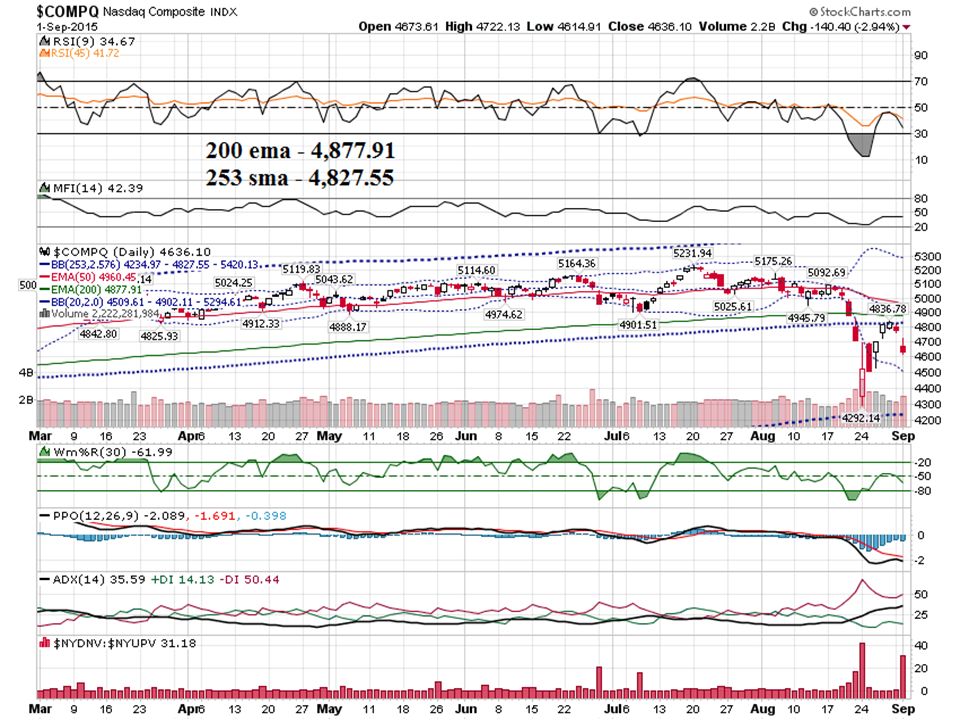
Let’s move onto the markets. And let’s take a look at the August 2015 Monthly Charts for the major markets.

19
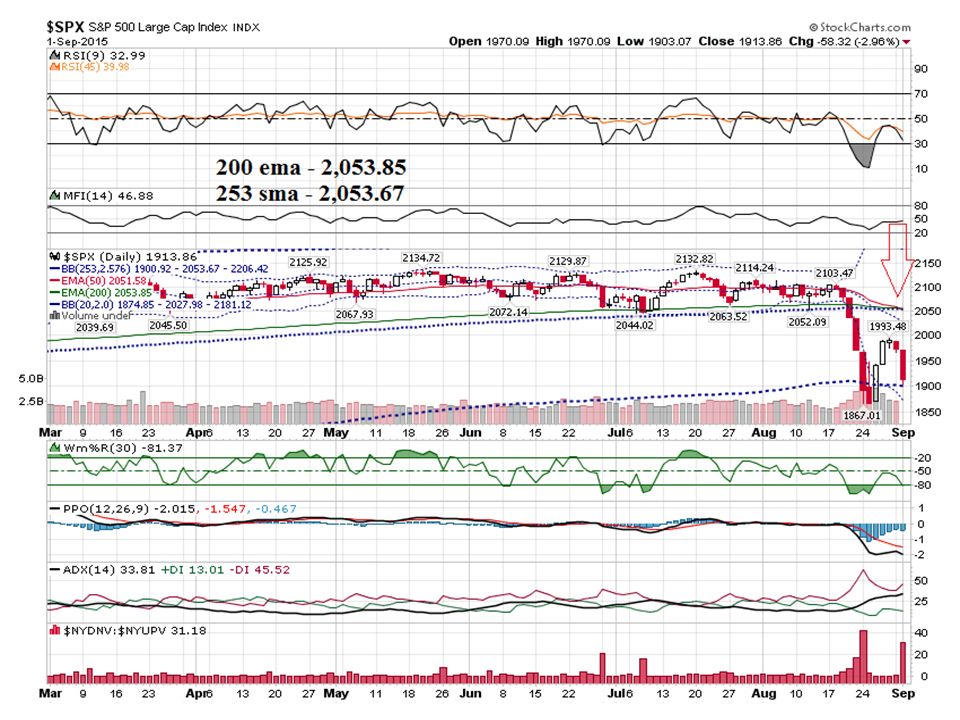
As I outlined in the Special Report I wrote last week, the key technical condition I am watching is a bearish cross on the SPX Daily Chart. Let’s take a look at it …

23
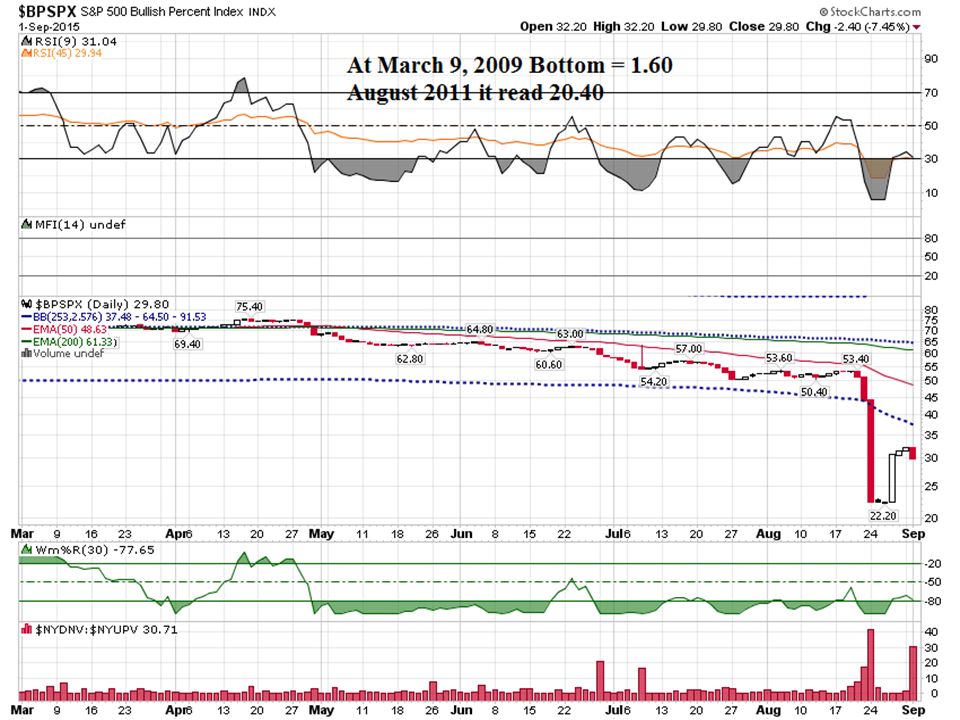
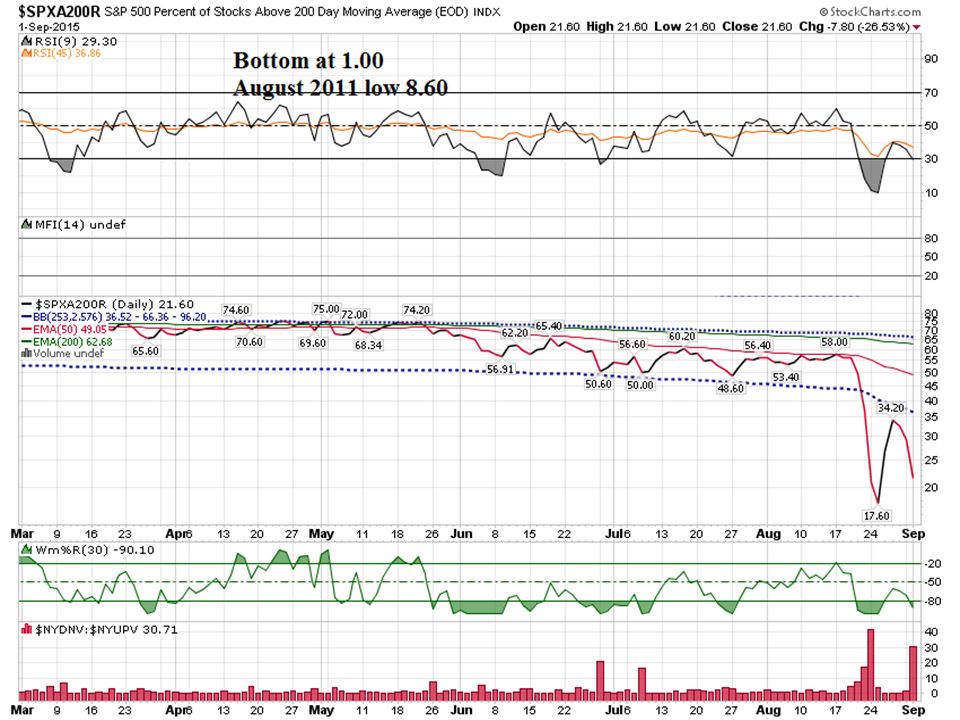
Let’s take a look at 2 sentiment Indicators.. $BPSX & $SPXA200R

26
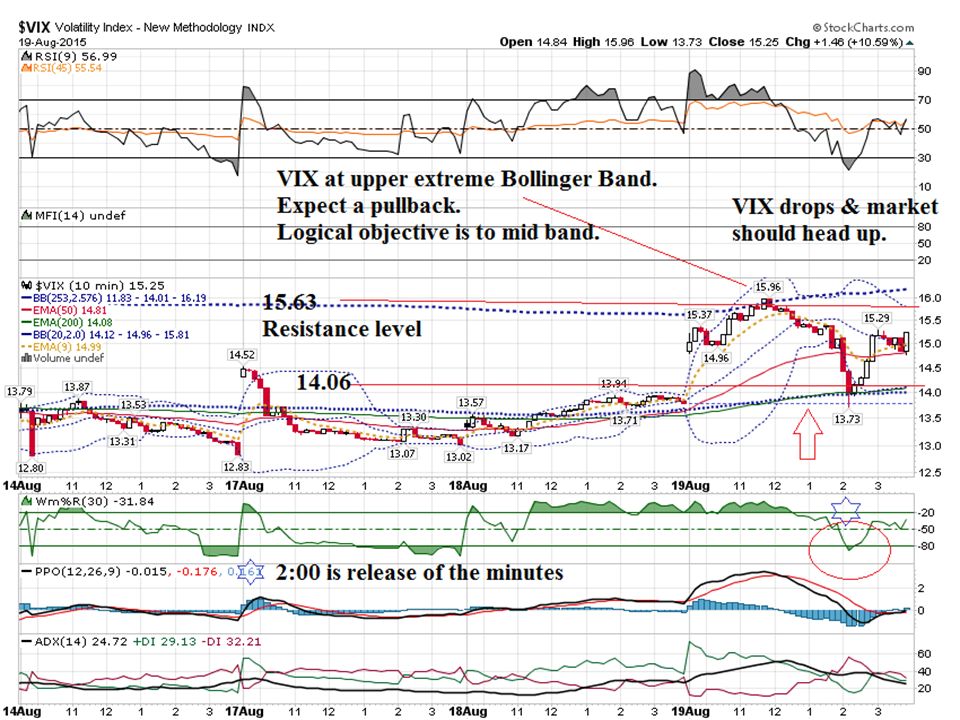
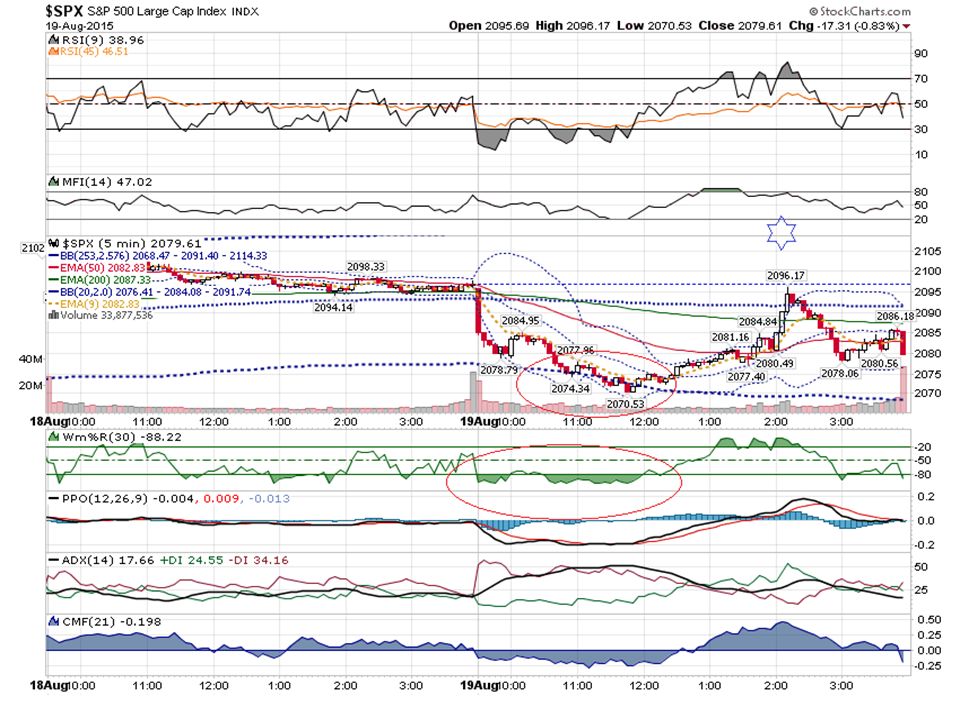
I want to look back to the day of our last webinar, which was August 19 th. It happened to be the release of the Fed Meeting notes at 2:00 EST.

27
For market wide events like this and the release of the Non Farm payroll at 8:30 EST the 1 st Friday of every month, the instruments to consider trading are the TLT, SPY, GDX and the VXX.

28
Let’s start by taking a look at the VIX to see what it is doing.

33
SPY $208 Weekly Call $.96 to $2.36

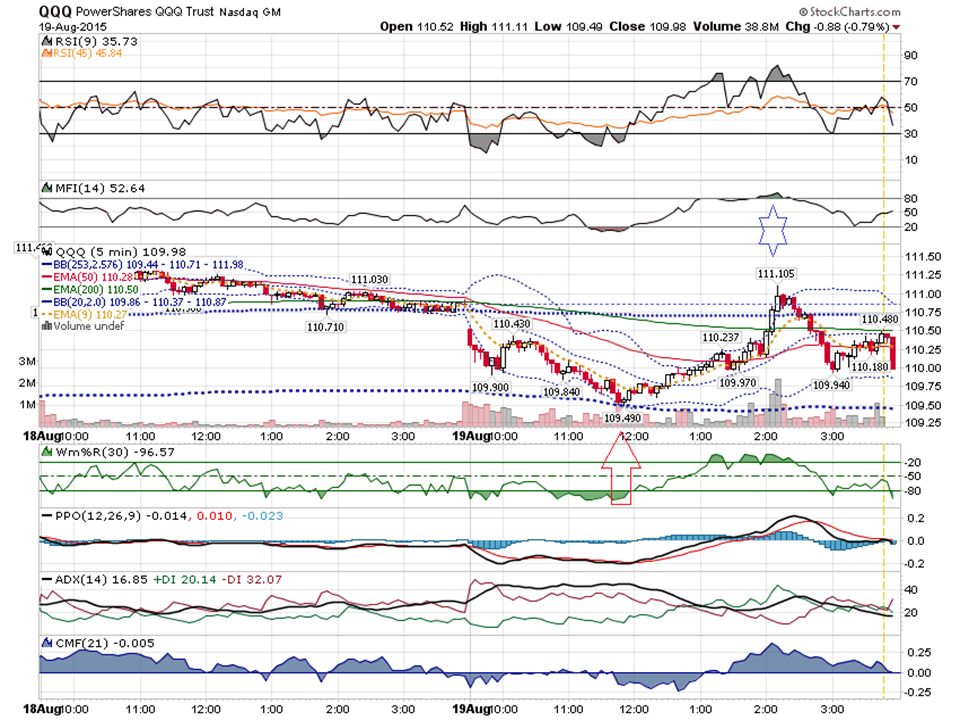
36
QQQ $109.50 Weekly Call $.72 to $1.62

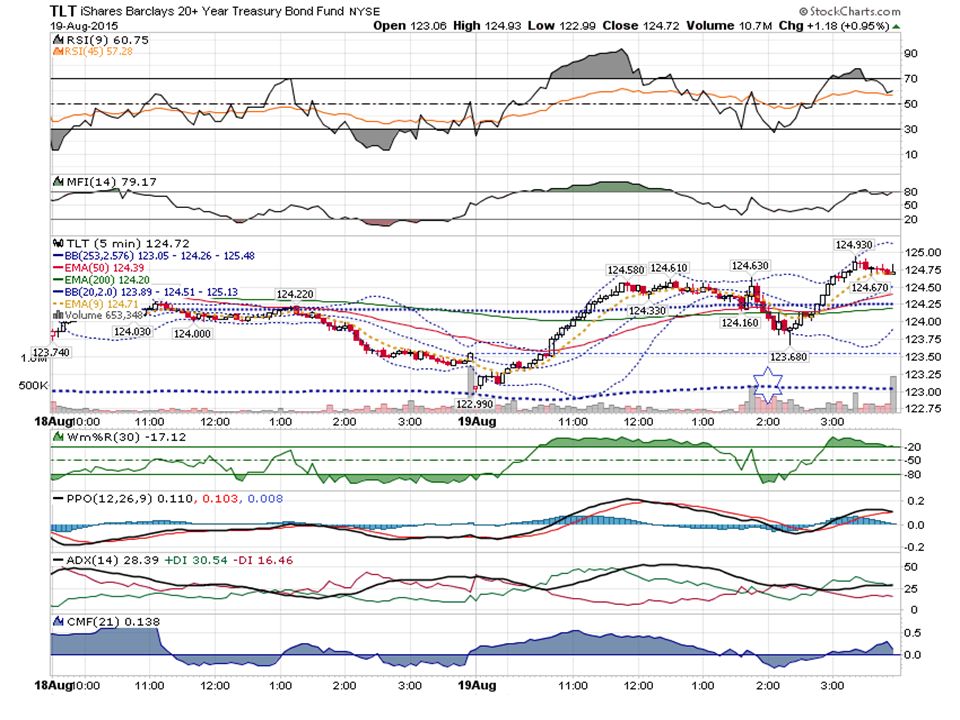
38
TLT Weekly Options 124 Call.41 to 1.00 123.50 Call.80 to 1.35

39
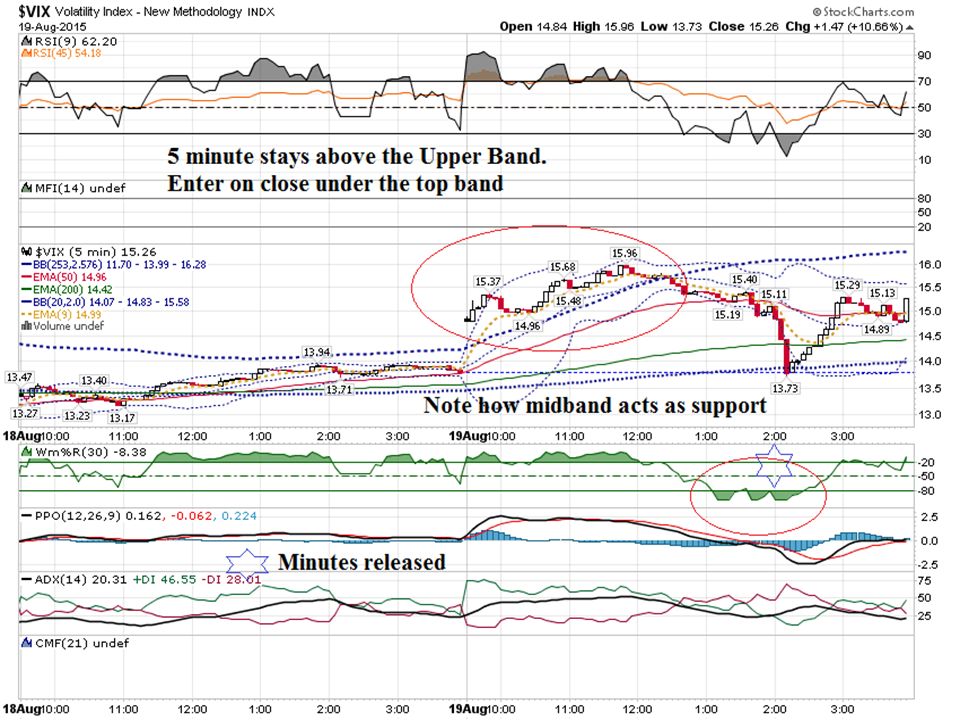
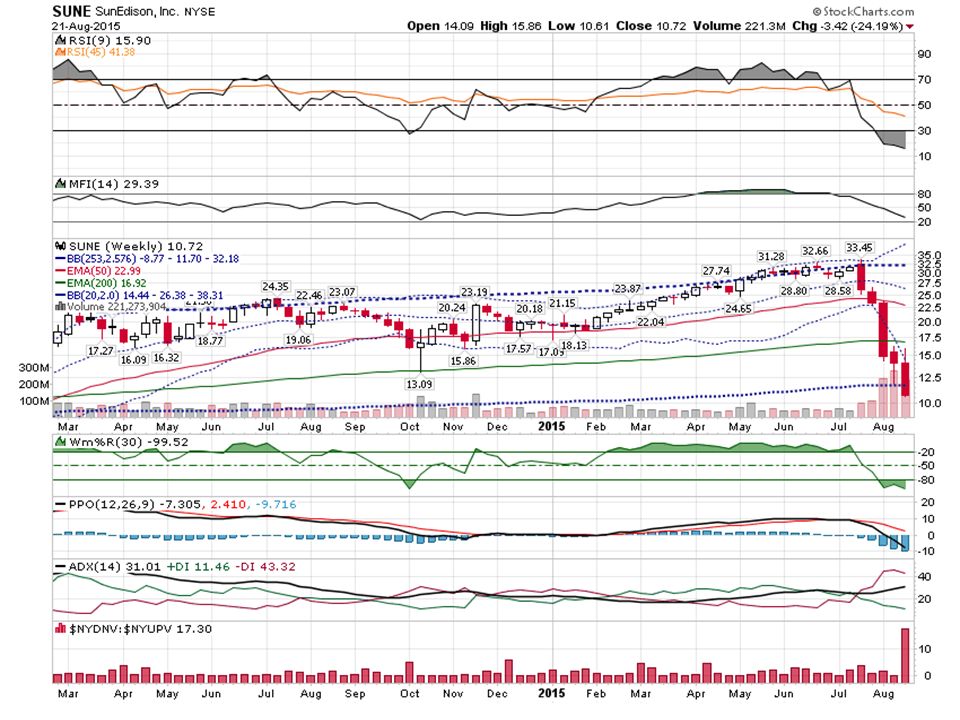
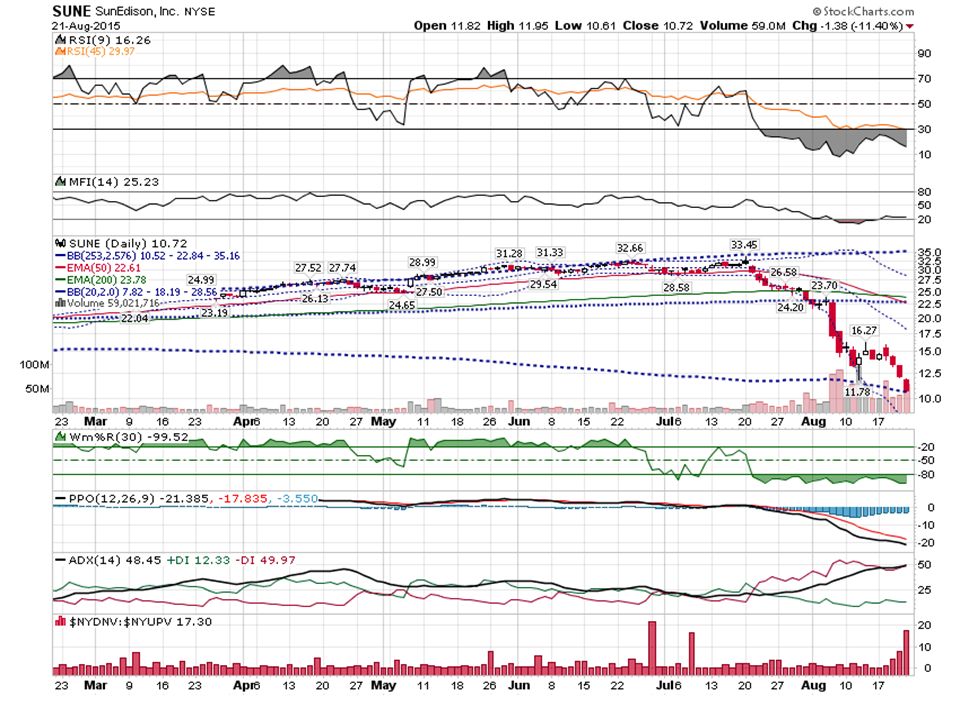
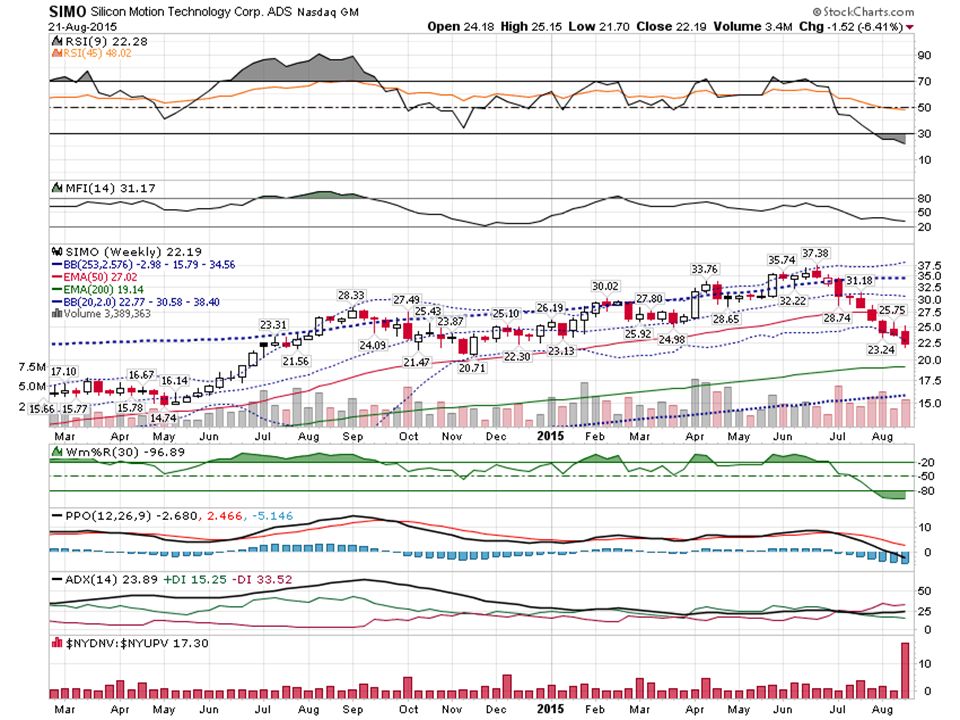
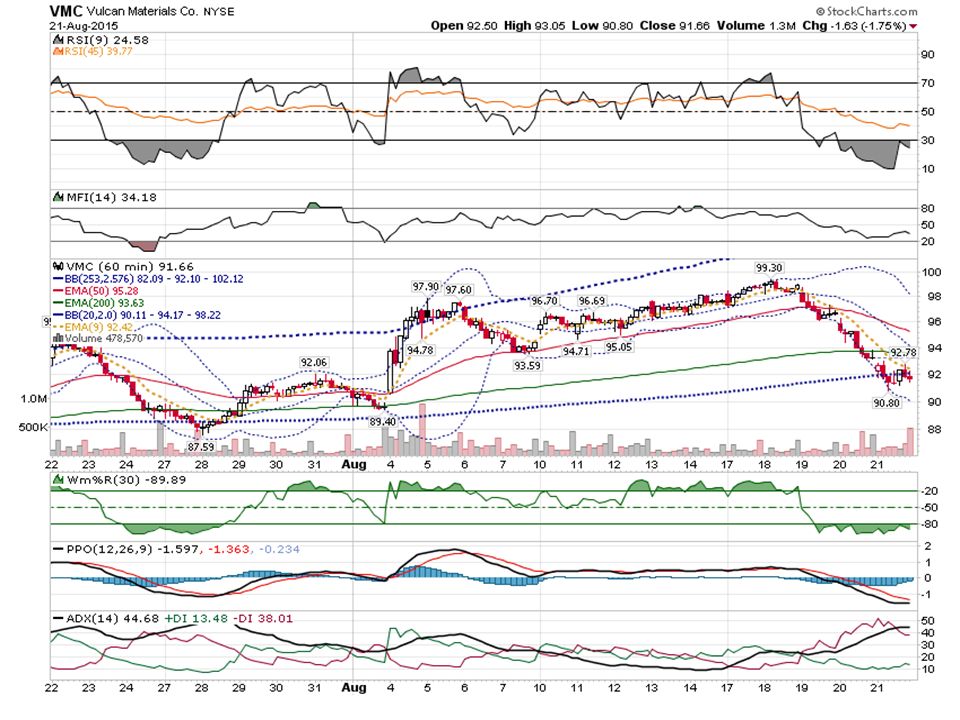
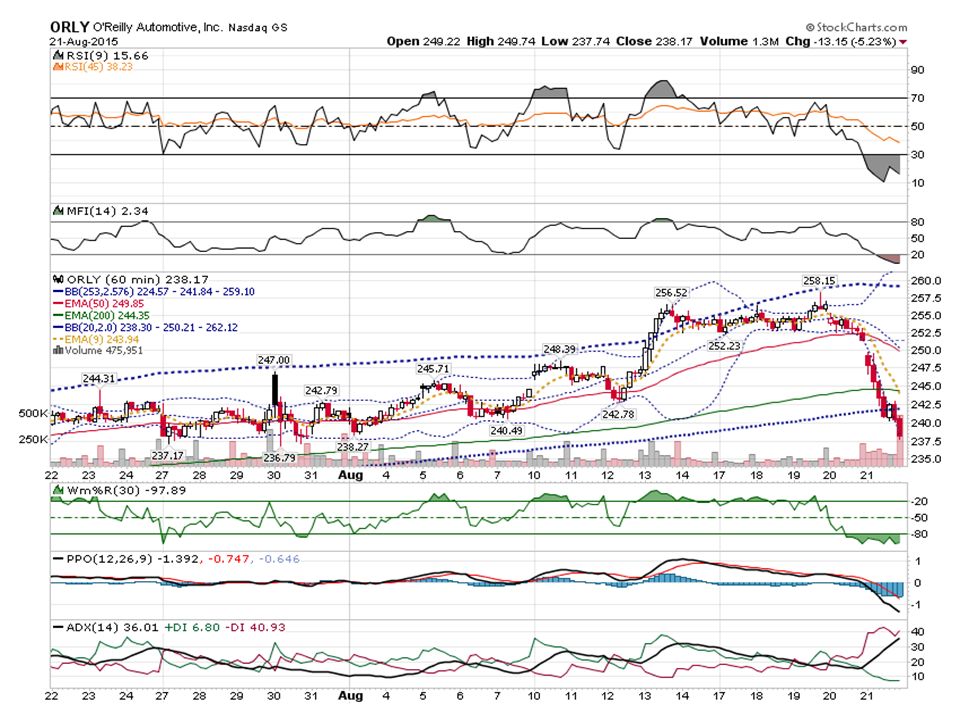
I want to take a look at a few charts that sold off against the top Upper Extreme Bollinger Band.

40
Have you started to use these Bollinger Band Settings?

45
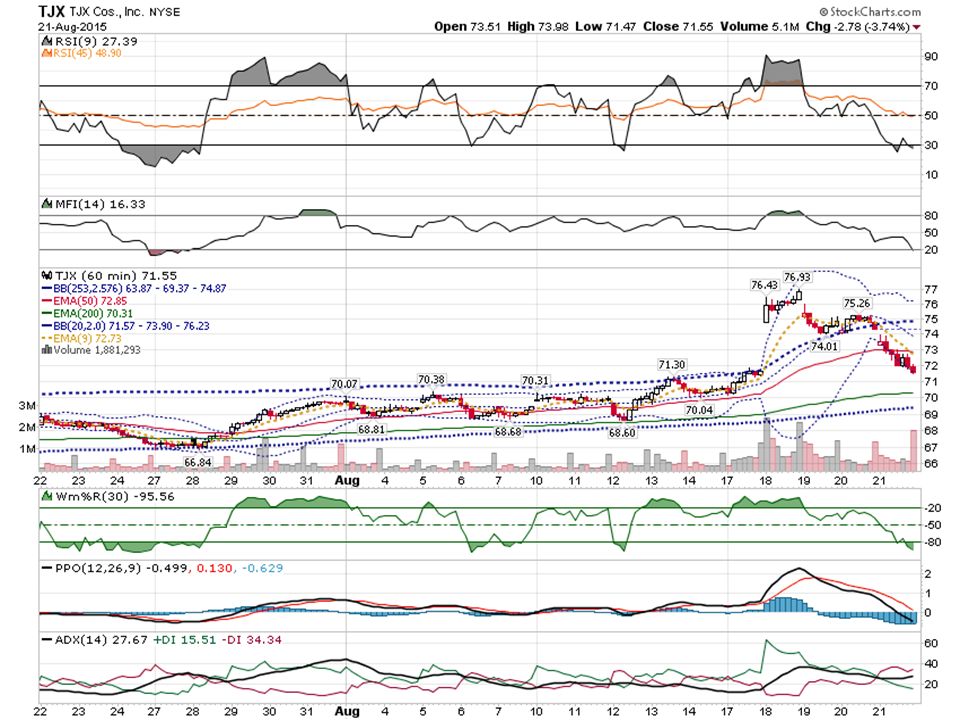
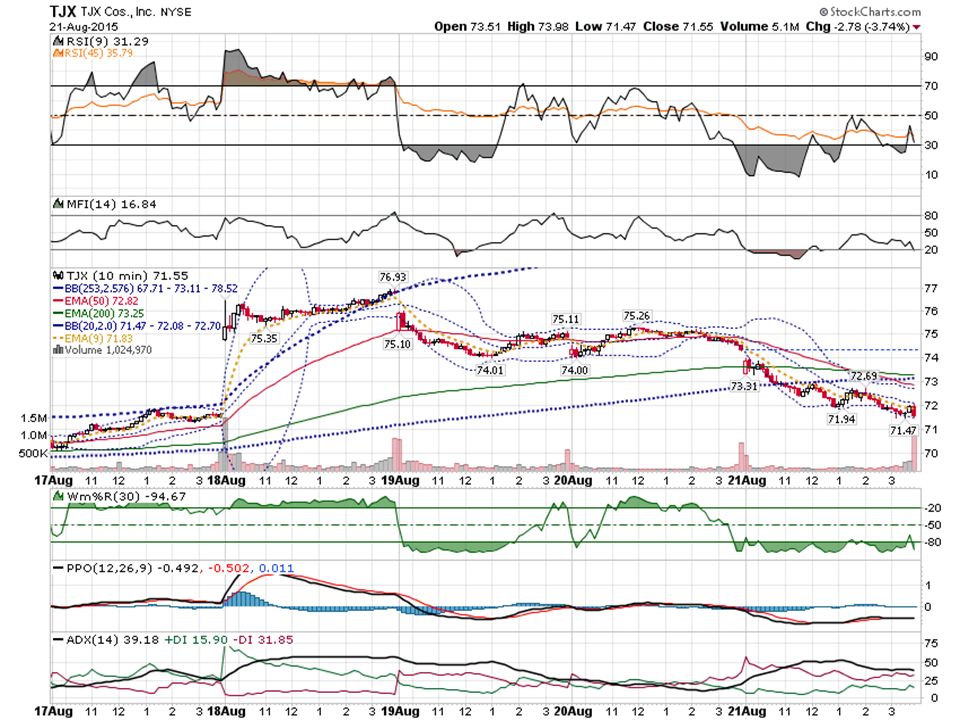
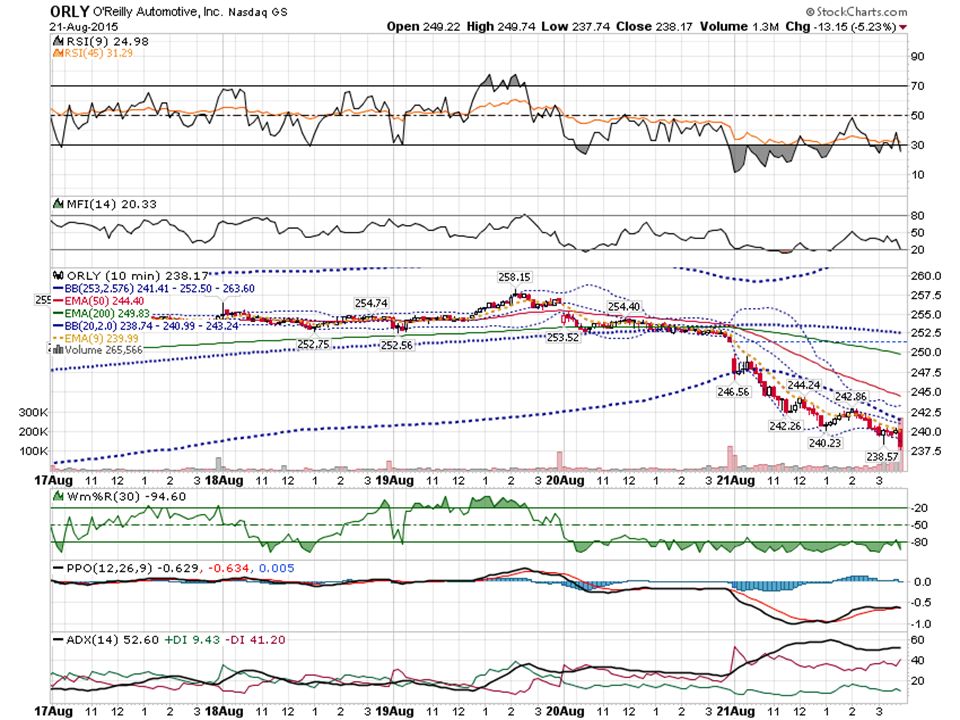
Let’s look at short timeframes …

52
Thanks for watching! Bill Davis Mad Day Trader September 2, 2015 davismdt@gmail.com

Similar presentations