Download presentation
Presentation is loading. Please wait.

1
Quiz #4

2
What should be on the graph? X axis, the horizontal line usually represents quantity. Y axis, the vertical line usually represents price. The whole graph should describe the supply and demand of ONE product. Draw both supply and demand curves on the same graph.

3
Graph you should keep in mind quantity price Demand curve (downward sloping) Supply curve (upward sloping) equilibrium Pe Qe
 Supply curve (upward sloping) equilibrium Pe Qe")
4
Movement or Shift Movement is caused only by the change of the price of the product on the graph. Lots of factors cause shift. (review your notes)
.")
5
Equilibrium For a pair of given demand and supply curves, there is only one intersection, therefore only one equilibrium. You will get a new equilibrium after the shift of supply or demand curve. The movement along supply or demand curve doesn’t give you a new curve, thus your can’t get a new equilibrium. Quiz, question 2, a-d

6
One step deeper After the change of equilibrium, the equilibrium price is also changed. The change of the price will probably cause the change of the supply or demand. Quiz 4, question 1

7
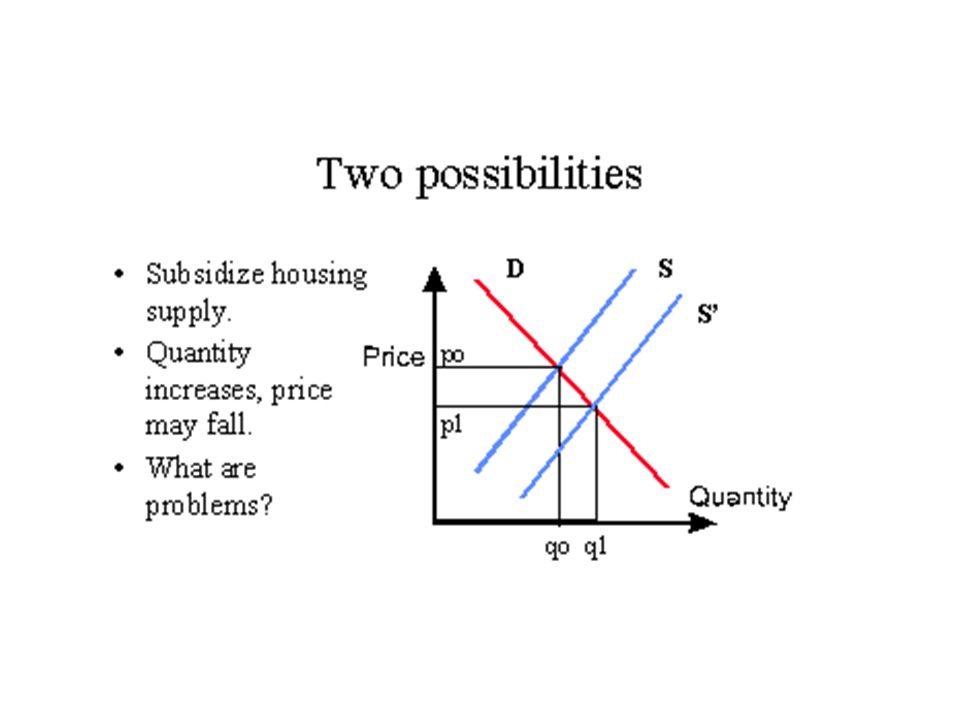
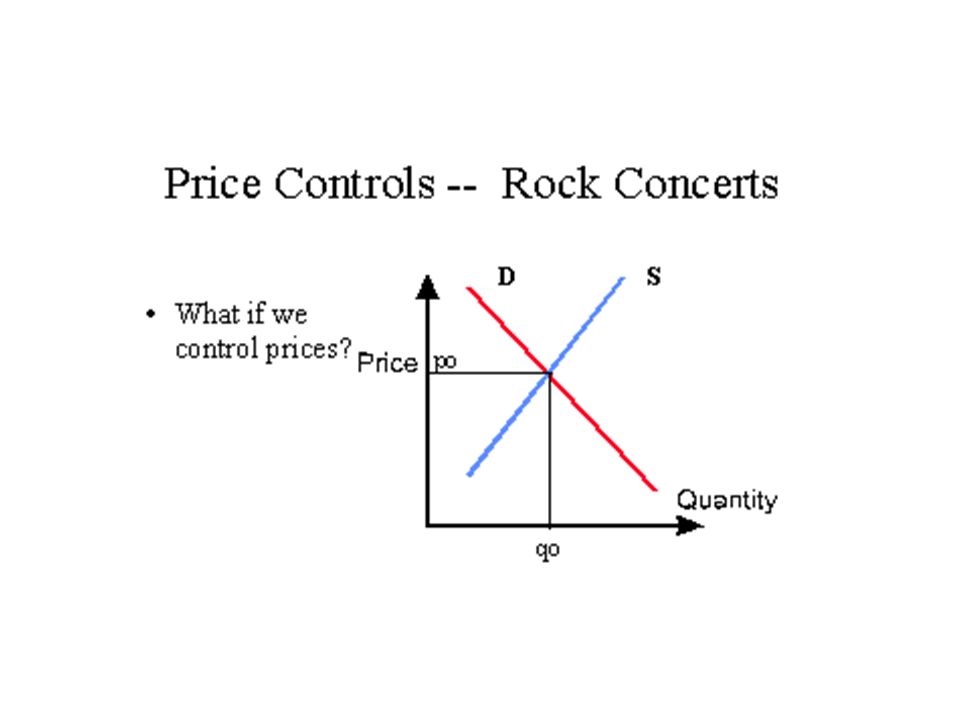
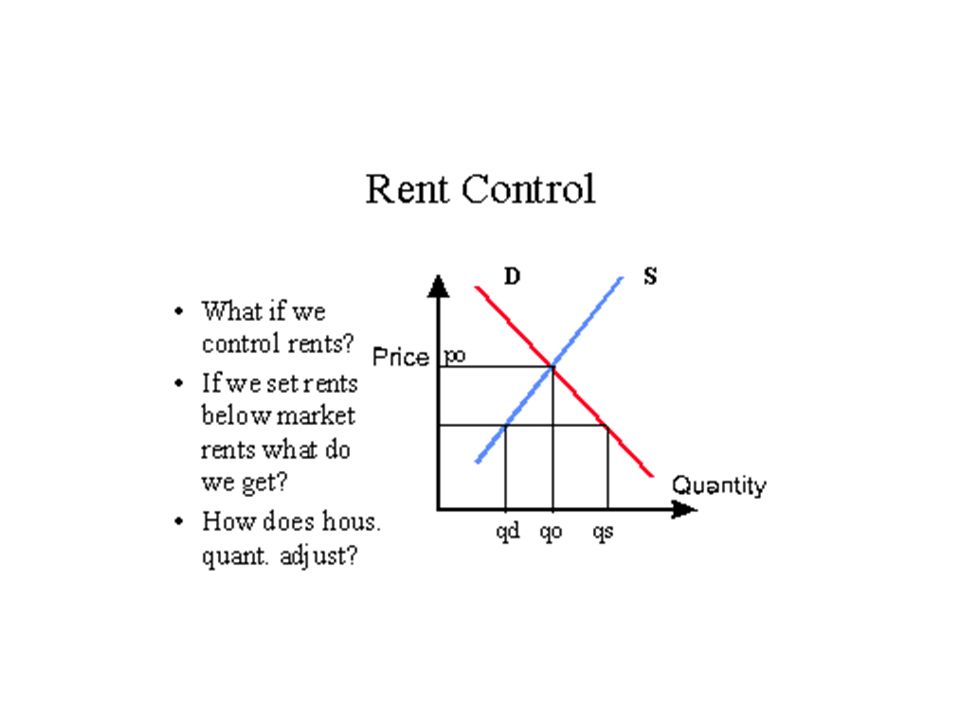
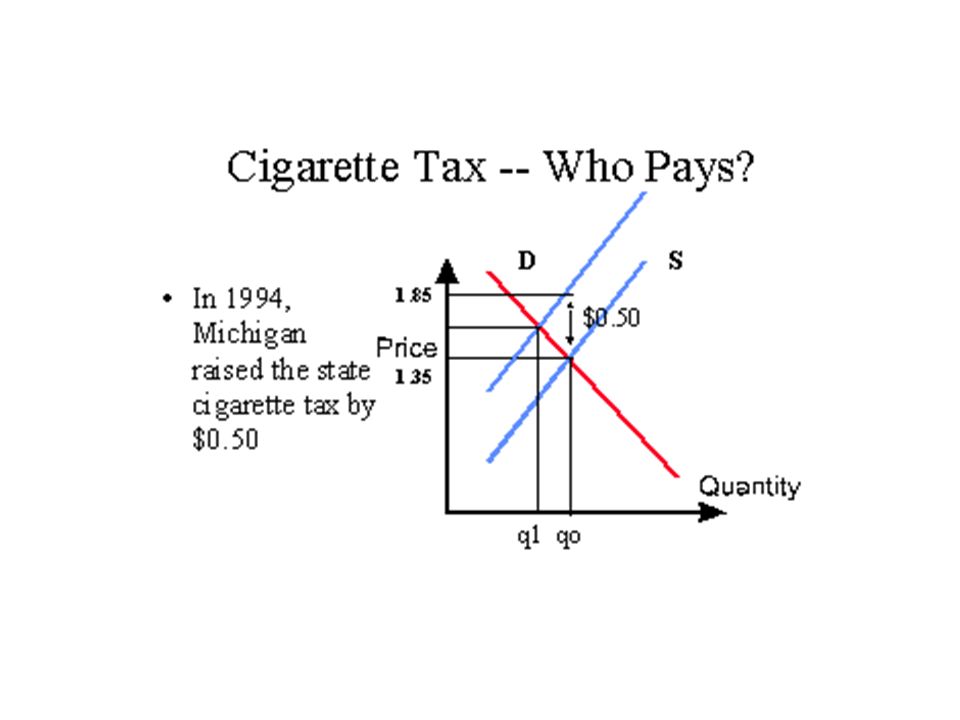
Examples of supply and demand Example 1 market for gasoline in summer Example 2 housing analysis Example 3 price control and rent control Example 4 cigarettes tax-who pays

21
Homework Page 95 –1,5,7,10 Page 121 –7,8

22
Chapter 5 The price system, supply and demand, and elasticity

23
The Price System: Rationing and Allocating Resources The price system performs two important and closely related functions in a society with unregulated markets. –PRICE RATIONING –ALLOCATING RESOURCES

24
PRICE RATIONING PRICE RATIONING: is the process by which the market system allocates goods and services to consumers when quantity demanded exceeds quantity supplied. Consider the following example in the market for lobster...

25
This rationing process determines: the allocation of resources among suppliers the final mix of output to be allocated across consumers

26
Price Rationing in the Market for Lobsters Figure 5.1 At $3.27, the quantity demanded and quantity supplied are both 47 lobsters. Suppose the supply of lobster shifts to the left. At a price of $3.27, there is now a demand of 22 lobsters.

27
Equilibrium is restored. Equilibrium is restored at a price of $4.50. Quantity supplied rises and quantity demanded falls as price rises. Thirty-five million pounds of lobster is “rationed ” to the consumers who are willing and able to pay $4.50 per pound for it.

28
Constraints on the market and alternative rationing mechanisms Some of these methods include: –Price ceilings: a maximum price that sellers may charge for a good, usually set by government. –Queuing: waiting in line as a means of distributing goods and services; a non price rationing mechanism. –Favored customers: those who receive special treatment from dealers during situations of excess demand. –Ration coupons: tickets or coupons that entitle individuals to purchase a certain amount of a given product per month. –Black market: a market in which illegal trading takes place at market-determined prices.

29
Oil supply in 1973-1974 Figure 5.3 Congress: price ceiling Most common non price rationing system: queuing… A second device: favored customers Another way: ration coupons Black market

30
Price and the allocation of resources Figure 5.4

31
World Cup Soccer championship in 1994... Consider the market for tickets to major sporting events, like the finals of the World Cup Soccer championship in 1994... The problem with these alternatives: excess demand is created but not eliminated.

32
World Cup Soccer championship in 1994... $3,000 The average ticket price was set at $300 for the final game of the World Cup. $300 This price was below the equilibrium price, and scalpers made a tidy profit. Can you explain why? Scalper’s profit The actual demand curve

33
SUPPLY AND DEMAND ANALYSIS: AN OIL IMPORT FEE An oil import fee would place a tax on all oil imported into the U.S... Why might politicians choose to impose such a tax?

34
The world and US markets for crude oil in 1989 (w/o tax) p q p q Sworld D.usa S.usa Dworld $18 Millions of Barrels/day 567.713.6 5.9
 p q p q Sworld D.usa S.usa Dworld $18 Millions of Barrels/day")
35
The import tax raises the price of all gasoline in the U.S. p q D.usa S.usa $18 $24 Millions of Barrels/day 7.713.6 5.9 What is the impact of this policy on : domestic producers? foreign producers? U.S. consumers? U.S. government?

36
The import tax raises the price of all gasoline in the U.S. p q D.usa S.usa $24 7.713.6 5.9 p q D.usa S.usa $24 9.012.2 3.2 $18 Import fee Government tax revenue

37
Review questions What is price rationing? Apply the knowledge.

Similar presentations