Download presentation
Presentation is loading. Please wait.

1
International Capital Flows and Capital Account Liberalization Thorvaldur Gylfason

2
Two Parts Part One: International Capital Movements International Capital Movements Part Two: External Debt Dynamics External Debt Dynamics

3
Goods and Capital The argument for free trade in goods and services applies also to capital Trade in capital helps countries to specialize according to comparative advantage, exploit economies of scale, and promote competition Exporting equity in domestic firms not only earns foreign exchange, but also secures access to capital, ideas, know-how, technology 1

4
Symmetry between Trade in Goods and Capital The balance of payments R = X – Z + F where X = exports of goods and services X = exports of goods and services Z = imports of goods and services Z = imports of goods and services F = net exports of capital F = net exports of capital Foreign direct investment Foreign direct investment Portfolio investment Portfolio investment Foreign borrowing Foreign borrowing

5
Determinants of Foreign Trade Trade in goods and services depends on Relative prices at home and abroad Exchange rates (elasticity models) National incomes at home and abroad Geographical distance from trading partners (gravity models) Trade policy regime Tariffs and other barriers to trade
 National incomes at home and abroad Geographical distance from trading partners (gravity models) Trade policy regime Tariffs and other barriers to trade")
6
Two Views of Trade The current account of the balance of payments is defined as B = X – Z National income is Y = E + X – Z Therefore, current account is B = X – Z = Y – E Two sides of the same coin: Deficit means that Z > X and E > Y Surplus means that X > Z and Y > E

7
Foreign Investment Capital flows Foreign borrowing, portfolio investment, foreign direct investment Trade in equities depends on Interest rates at home and abroad Exchange rate expectations Geographical distance from trading partners Capital account policy regime Capital controls and other barriers to free flows

8
Exports 1990-2000 (% of GDP)
")
9
Transition Countries: Exports 2000 (% of GDP) World average
 World average")
10
Growth in Trade Less Growth in GDP 1990-2000 (%)
")
11
FDI 1990-2000 (Net, % of Gross Investment)
")
12
FDI 1990-2000 (Gross, % of GDP)
")
13
Transition Countries: FDI 2000 (Net, % of Gross Investment) World average
 World average")
14
Transition Countries: FDI 2000 (Gross, % of GDP) World average
 World average")
15
Capital Flows Facilitate borrowing abroad to smooth consumption over time Dampen business cycles Reduce vulnerability to domestic economic disturbances Increase risk-adjusted rates of return Encourage saving, investment, and growth

16
Openness to FDI and Growth 1965-98 Botswana An increase in openness to FDI by 2% of GDP is associated with an increase in per capita growth by more than 1% per year. r = 0.62 85 countries r = rank correlati on

17
Openness to Trade and Growth 1965-98 87 countries An increase in openness by 14% of GDP is associated with an increase in per capita growth by 1% per year. r = 0.42

18
Tariffs and Growth 1965-98 82 countries An increase in tariffs by 10% of imports is associated with a decrease in per capita growth by 1% per year. r = -0.52 India Cote d'Ivoire Botswana

19
Pitfalls: Incomplete Information Capital account liberalization, if well managed, stimulates saving and investment, efficiency, and economic growth But information may be asymmetric Adverse selection Moral hazard Herding

20
Capital Account Liberalization Needs to be orderly, gradual, well- sequenced Effective prudential regulation To encourage banks to recognize risks To enable authorities to monitor threats to stability of the financial system Sound macroeconomic policies Sequencing Put bank supervision and sound policies in place first, then liberalize

21
External Debt Dynamics and Sustainability 2 Many countries have developed rapidly with the aid of external loans (US, Korea) But many other countries have fared less well with their external debt strategies because they borrowed abroad to finance consumption, not investment Consumption does not increase the ability of indebted countries to service their debts, nor does low-quality investment But high-quality investment does
 But many other countries have fared less well with their external debt strategies because they borrowed abroad to finance consumption, not investment Consumption does not increase the ability of indebted countries to service their debts, nor does low-quality investment But high-quality investment does")
22
External Debt: Key Concepts Debt burden Also called debt service ratio Equals the ratio of amortization and interest payments to exports q = debt service ratio A = amortization r = interest rate D F = foreign debt X = exports

23
Interest burden Ratio of interest payments to exports q = a + b Amortization burden Also called repayment burden Ratio of amortization to exports External Debt: Key Concepts

24
How can we figure out a country’s debt burden? Divide through definition of q by income Now we have expressed the debt service ratio in terms of familiar quantities: the interest rate r, the debt ratio D F /Y, and the export ratio X/Y as well as the repayment ratio A/Y External Debt: Numbers

25
Suppose that r = 0.08 D F /Y = 0.50 A/Y = 0.06 X/Y = 0.20 Here we have a country that has to use a half of its export earnings to service its external debt Heavy burden! Numerical Example

26
Transition Countries: External Debt 2000 (PDV, % of GDP)
")
27
Transition Countries: External Debt 2000 (% of Exports)
")
28
Transition Countries: External Debt Service 2000 (% of Exports)
")
29
Debt accumulation is, by its nature, a dynamic phenomenon A large stock of debt involves high interest payments which, in turn, add to the external deficit, which calls for further borrowing, and so on Debt accumulation can develop into a vicious circle How do we know whether a given debt strategy will spin out of control or not? To answer this, we need a little arithmetic External Debt Dynamics

30
Recall balance of payments equation: BOP = X – Z + F where F = capital inflow = D F where D F = foreign debt Capital inflow, F, thus involves an increase in the stock of foreign debt, D F, or a decrease in the stock of foreign claims (assets) So, F is a flow and D F is a stock External Debt Dynamics
 So, F is a flow and D F is a stock External Debt Dynamics")
31
Now assume Z = Z N + rD F Z = total imports Z N = non-interest imports rD F = interest payments Further, assume X = Z N BOP = 0 A flexible exchange rate maintains equilibrium in the balance of payments at all times Then, it follows that BOP = X – Z + D F = 0 so that D F = rD F D F = rD F In other words: External Debt Dynamics

32
So, now we have: Now subtract growth rate of output from both sides: External Debt Dynamics

33
But what is This is the proportional change of the debt ratio: ? This is an application of a simple rule of arithmetic: % (x/y) = % x - % y External Debt Dynamics
 = % x - % y External Debt Dynamics.")
34
z = x/y log(z) = log(x) – log(y) log(z) = log(x) - log(y) But what is log(z) ? So, we obtain Q.E.D. Proof

35
We have shown that where Debt ratio Time r g r = g r g Need economic growth to keep the debt ratio under control Debt, Interest, and Growth

36
It is important to keep economic growth at home above – or at least not far below – the world rate of interest Otherwise, the debt ratio keeps rising over time External deficits can be OK, even over long periods, as long as the external debt does not increase faster than output and the debt burden is manageable to begin with A rising debt ratio may also be OK as long as the borrowed funds are used efficiently Once again, high-quality investment is key What Can We Learn from This?

37
Let us now study the interaction between trade deficits, debt, and growth Two simplifying assumptions: D t = aY t (omit the superscript F, so D = D F ) Trade deficit is a constant fraction a of output Y t = Y 0 e gt Output grows at a constant rate g each year Y t Exponential growth Debt Dynamics: Another Look
 Trade deficit is a constant fraction a of output Y t = Y 0 e gt Output grows at a constant rate g each year Y t Exponential growth Debt Dynamics: Another Look")
38
Y time Exponential growth implies a linear logarithmic growth path whose slope equals the growth rate log(Y) time 1 g Pictures of Growth
 time 1 g Pictures of Growth")
39
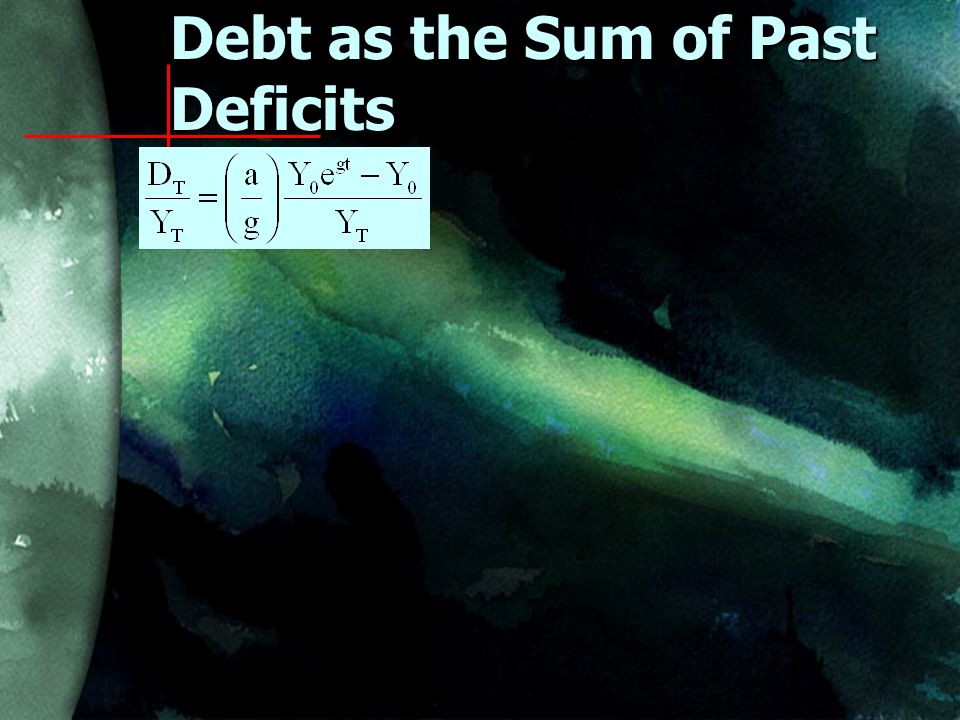
at time T Debt as the Sum of Past Deficits

40
at time T Debt as the Sum of Past Deficits

41
Evaluate this integral between 0 and T at time T Debt as the Sum of Past Deficits

42
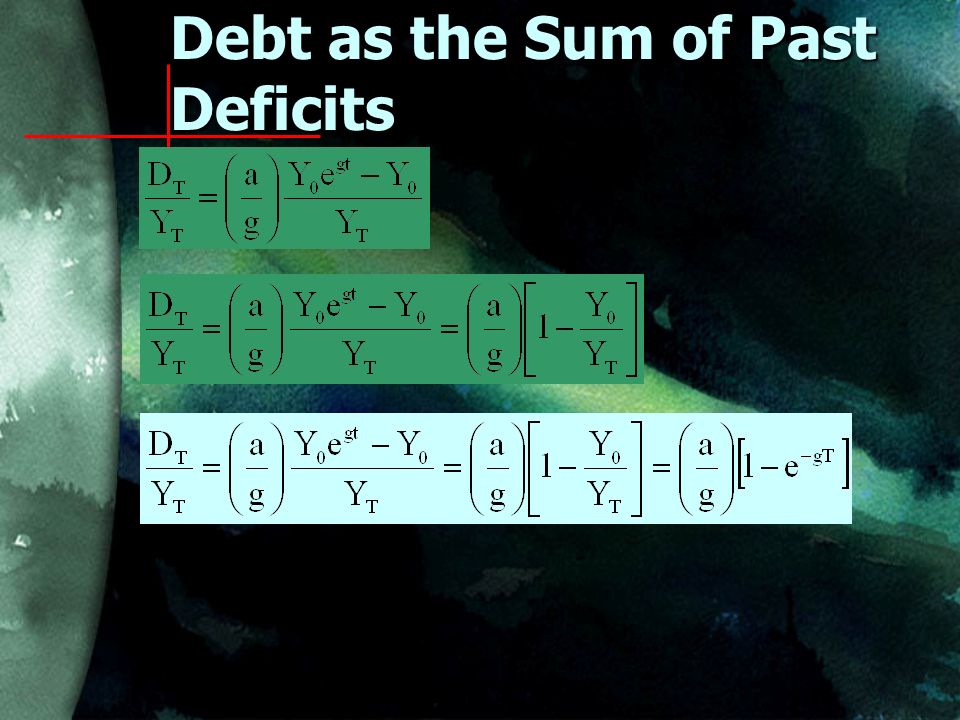
Evaluate this integral between 0 and T So, as T goes to infinity, D t becomes infinitely large. But that may be quite OK in a growing economy! at time T Debt as the Sum of Past Deficits

46
So, as T goes to infinity, D T /Y T approaches the ratio a/g Debt as the Sum of Past Deficits

47
Suppose Trade deficit is 6% of GNP a = 0.06 Growth rate is 2% per year g = 0.02 Then the debt ratio approaches d = a/g = 0.06/0.02 = 3 This point will be reached regardless of the initial position...... as long as a and g remain unchanged Debt ratio Time 3 NumericalExample

48
Suppose that r = 0.08 (as before) D/Y = 3 D/Y = 3 (our new number) A/Y = 0.06 (as before) X/Y = 0.20 (as before) Here we have a country that has to use one and a half of its export earnings to service its debts Heavy burden, indeed!!! Numerical Example, Again

49
Suppose that r = 0.08 (as before) D/Y = 2 D/Y = 2 (our new number) A/Y = 0.06 (as before) X/Y = 0.20 (as before) Here we have a country that has to use one and a half of its export earnings to service its debts Heavy burden, indeed!! Numerical Example, Again

50
Suppose that r = 0.08 (as before) D/Y = 1 D/Y = 1 (our new number) A/Y = 0.06 (as before) X/Y = 0.20 (as before) Here we have a country that has to use one and a half of its export earnings to service its debts Heavy burden, indeed! Numerical Example, Again

51
Suppose that r = 0.08 (as before) D/Y = 1 D/Y = 1 (our new number) A/Y = 0.06 (as before) X/Y = 0.40 (as before) Here we have a country that has to use one and a half of its export earnings to service its debts Heavy burden, but manageable Numerical Example, Again
 D/Y = 1 D/Y = 1 (our new number) A/Y = 0.06 (as before) X/Y = 0.40 (as before) Here we have a country that has to use one and a half of its export earnings to service its debts Heavy burden, but manageable Numerical Example, Again")
52
Must adjust policies Must either Reduce trade deficit by stimulating exports or by reducing imports, or Reduce trade deficit by stimulating exports or by reducing imports, or Increase economic growth Increase economic growth Otherwise, the debt ratio will reach unmanageable levels, automatically No country can afford external debt equivalent to 2-3 times annual output What to Conclude?

53
Because, after a while, the debt burden becomes unbearable Korea avoided this Its export-oriented growth strategy reduced the numerator and increased the denominator of the debt ratio, thereby reducing its debt burden An import-substitution strategy would reduce both numerator and denominator, with an ambiguous effect on the debt burden And Why Not?

54
Transition Countries: External Debt Service 2000 (% of Exports) Still OK, but be careful! Recap
 Still OK, but be careful! Recap")
55
Borrowers often renegotiate the terms of their loans in mid-stream in order to delay repayments, that is, extend the maturity of the loans, or to delay repayments, that is, extend the maturity of the loans, or to reduce interest payments by replacing high- interest loans by loans with lower interest reduce interest payments by replacing high- interest loans by loans with lower interest Sometimes, outright debt forgiveness may be called for But debt forgiveness is no substitute for sound economic policies Remember: our formula d = a/g holds in the long run regardless of initial conditions Debt Renegotiations and Forgiveness

56
External borrowing is a necessary and natural part of economic development This requires countries that borrow to invest the funds borrowed in high-quality capital, including health and education This is necessary to be able to service the debt If the debt burden becomes too heavy, must either reduce deficit or stimulate growth It is always desirable anyway to do everything possible to encourage economic growth Rapid growth allows more foreign borrowing without making the debt burden unmanageable The Bottom Line

Similar presentations


; Kaminsky,>")


 S = I + (G-T) (Asset Market) There is only.>")


