Download presentation
Presentation is loading. Please wait.

1
Rainfall Spatial and Temporal Distribution in Sumber Jaya, West lampung Rita Manik

2
Back ground There was environmental degradation in Sumber Jaya, including the flood in February 2002 that damaged the power plant and causing a serious shortage of electricity in Lampung Province as well as periodic water deficits needed to drive the turbines during the dry season

3
Preservation of watershed functions and erosion control are the two major arguments for retaining forests in Sumber Jaya as protection areas Local governments blamed coffee farmers for the problems. Such accusations create conflicts between local forestry officers and villagers who claim that the previous government officials officially transferred some parts of the land within the forest zone to them and they have the right to manage the lands as they wish

6
Rainfall distributions VS Land use changes Natural forrest VS Agroforrest

7
Problems Rainfall – runoff relationship in catchment scale The rainfall--runoff relationship quantifies the response function describing the behaviour of a watershed. The response function is a result of numerous processes, complex and interdependent, that participate in the transformation of rainfall into runoff (Singh and Birsoy, 1977).
..")
8
Water input Rainfall Watershed Water discharge output

9
Rainfall distribution Temporal distribution Rain depth Spatial distribution

10
Research site

11
Methods

12
Nested catchments

13
CatchmentArea (ha)Mean slope (%) 12.8429 28.2146 312.3933 420.4520 527.2226 WB67.6826 FR10.39 AF 4.39
Mean slope (%) WB FR10.39 AF 4.39")
15
Rain gages

16
Parshall Flumes

19
Methods Rainfall temporal distribution: cross-correlations auto-correlations Rainfall spatial distribution : cross-correlations Kriging

20
Rainfall temporal distribution :

22
Daily Average of coefficient correlation among catchments DateC1C3C4C5CAFCFR 16-Jul-050.2983450.403841 0.4590690.3070980.190206 18-Jul-050.5100470.4667250.5742630.2441290.443542 19-Jul-050.9524860.9606620.977490.9737130.931874 02-Aug-050.4405780.3686320.5229440.2638330.313566 21-Aug-050.4718790.243920.5176870.3145810.292299-0.04579 22-Aug-050.7777050.7824640.7451090.6523870.5726820.413579 25-Sep-050.7813950.7641450.8041010.6990940.5883460.205309 18-Oct-050.7128140.7222810.7015960.5822180.393156 22-Oct-050.5668680.6960740.6229750.5097450.329756 23-Oct-050.5840930.5301360.446260.1697810.258088 25-Oct-050.723630.6344890.6073060.4359970.479590.257356 26-Oct-050.8391830.7504040.7354570.6052030.360082 03-Nov-050.457470.6735180.6107620.4415470.172871 18-Nov-050.6840720.7203890.6978290.6407430.340826 19-Nov-050.709190.6463490.4534320.5580360.395826 20-Nov-050.4342340.4703420.1512990.2992280.114708-0.33936 25-Nov-050.6644260.6497880.6211620.5782450.4115510.081998 27-Nov-050.5104510.4983570.5252820.2787410.195067-0.03525 07-Dec-050.7187570.657730.5204780.5098830.4694420.199205 08-Dec-050.5856080.5555130.4753660.4251760.065773 27-Dec-050.633060.6899960.6078750.5352250.31452

23
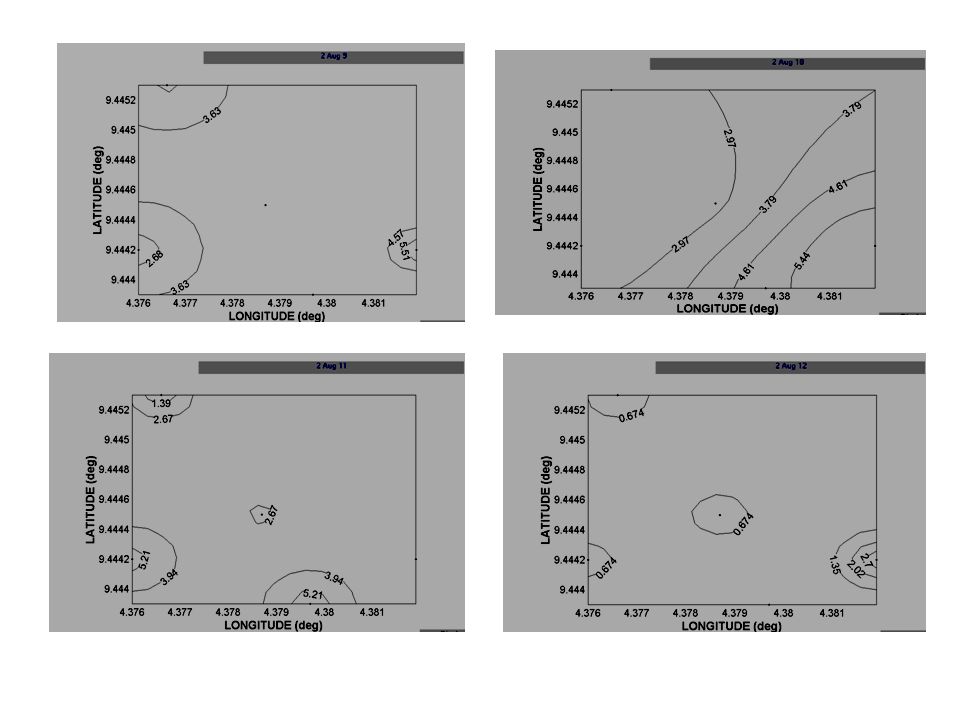
02-Aug-05 C3CAFC5CWBCFR C10.4818590.6835160.5433760.3927480.437479 C3 0.3878650.5450660.5649440.278007 CA F 0.3506560.3288150.199111 C5 0.3968590.745667 CW B 0.315157 23-Oct-05 C3CAFC4C5CWB C1 0.69664 20.80793272 0.84471 1 0.31038 60.45579 C3 0.738999790.740770.36855 0.59215 5 CAF 0.82104 2 0.29449 3 0.48797 5 C4 0.27424 50.45406 C5 0.21170 4

24
Time lags 16-Jul-0518-Jul-0502-Aug-0521-Aug-05 LagsWBFRCAFCFRCAFCFRFRWB 20.78530.85720.51750.58440.78400.88080.58520.1295 40.68680.77920.42650.41940.59350.73790.49350.4942 60.59550.69600.22700.18180.48160.58400.15230.3324 80.39770.57640.18410.13930.47740.43580.21760.2163 100.29790.4876 0.47760.29090.03240.2771 120.18250.3701 0.47760.21270.00980.3084 140.08190.2354 0.38570.1825-0.13050.0795 160.08020.1274 0.35350.1918-0.21550.2472 18 0.3369 20 0.3282 22 0.2557 24 0.2737 26 0.2267 28 0.1634

25
Time lags 22-Aug-0525-Sep-0518-Oct-0523-Oct-05 LagsCFRCWBCFRCWBCAF C5CWB 20.80530.56920.85910.73190.67910.76960.75000.8213 40.63760.25060.70270.45790.53440.70840.52910.6525 60.46610.11730.51190.15100.48260.57640.31240.4779 80.31450.10150.3328-0.01150.3940 0.17290.3322 10 0.13880.08410.2051 0.09920.2435

26
Spatial Distribution Average of coefficient correlation among catchments C3C4C5CAFCFRCWB C10.7212660.6717230.7775340.7515750.3846780.535187 C3 0.6187520.8070450.7642340.2537270.715793 C4 0.6867810.6016930.1992350.334294 C5 0.7146030.3158220.637122 CAF 0.2884170.550781 CFR 0.206051

31
02-Aug-05 SillLengthCentre 2.00430.45 1.23830.0925 1.37470.0925 1.31630.45C1 1.33440.45 C1 1.03020.45 C1 1.10340.45 C1 0.36530.45 C1 0.71580.0925 0.71580.0925 1.74650.0925 1.8750.0925 25-Sep-05 SillLengthCentre 1.19760.0925 1.55320.0925 0.86550.0925 1.8570.0925 1.75790.0925 1.87330.45C5

33
Conclusions A. Rainfall temporal distributions Over the nested catchments From 24 rain events only in 4 rain events one catchment have relatively high correlations (r≥ 0.7) to the rest of other catchments which might showed temporally homogenous pattern of rain From distances between catchments (Table 9) it can be concluded that rain pattern showed some correlations with r ≥ 0.7 only on the distances < 500 m.
 to the rest of other catchments which might showed temporally homogenous pattern of rain From distances between catchments (Table 9) it can be concluded that rain pattern showed some correlations with r ≥ 0.7 only on the distances < 500 m..")
34
Rainfall temporal distributions the longest time lags during rain events were 28 minutes and time lags when rain fell homogenously were only < 6 minutes. The rainfall maximum time lags between the catchments (28 minutes) could be considered as relatively short. Rain in catchments area generally fell suddenly, on relatively short time (between 12 to 150 minutes), in the afternoon or late afternoon (13:00 to 17:00) and often spread in patches; those characteristics indicated that types of rain were convective. Convective rain developed because of local surface heating.
 could be considered as relatively short. Rain in catchments area generally fell suddenly, on relatively short time (between 12 to 150 minutes), in the afternoon or late afternoon (13:00 to 17:00) and often spread in patches; those characteristics indicated that types of rain were convective. Convective rain developed because of local surface heating..")
35
Over Sumber Jaya catchment In general rain occurred on longer time and higher intensity (2 – 6 mm/2 min) on upper part of the catchment compared to the lower part (the nested catchments); they lasted from 150 -540 minutes; and preceded and ended with light rain. Since rain covered mostly the upper part of catchment and did not pour homogenously over the whole catchment, the rains probably were orographic rain. Air masses which moved horizontally were forced to lift because of topographic barriers.

36
Stations with distances 0.8); even though up to ≈ 17 km there was still exist some correlation (r ≈ 0.5). It can be concluded that rainfall distributions inside Sumber Jaya catchment from July to December were not homogenously covered the whole area and this could mean that moisture that came form uplifting movement due to topographic barrier only yield in local rain around the mountains. Time lags between the two stations were about 15 minutes. Probably time lags were not the important substances on this analysis since moisture came from different sources; not from one source and then moved to another area. The time lags did not reflect the time of storm moving from one source with certain directions.

37
Over the nested catchments In general source of rainfall in this catchment area mostly were not originated from single cloud cluster, rain was not centred in one area and spread with lower intensity to the surrounding area. It was most likely that small cluster of clouds were spread over the catchments, then grew and some times one cluster might dominated the area for short time. Only occasionally that rainfall in this area formed by one big cluster of cloud and continually dominated the area. This is related to what was explained on previous section that rain type over the catchments was convective type which developed from surface heating. The spread of the clouds could also reflect the uneven heating on catchments surface.

38
larger clusters mostly developed over catchment WB and over catchment 4 and 5. Hence, higher rain depths occurred on the down part (outlet) of the catchment, and sometimes on the middle part but rarely from the upper part. The catchments outlet (catchment WB) was closer to Mount Subhan (West part of the Sumber Jaya catchment) while catchment 1 was closer to Bukit Rigis area (central part of the catchment). Forest in Mount Subhan was in better coverage compared to Bukit Rigis, Bukit Rigis are the area of intense coffee plantations, consequently, Subhan were a better moisture sources than Bukit Rigis.
 of the catchment, and sometimes on the middle part but rarely from the upper part. The catchments outlet (catchment WB) was closer to Mount Subhan (West part of the Sumber Jaya catchment) while catchment 1 was closer to Bukit Rigis area (central part of the catchment). Forest in Mount Subhan was in better coverage compared to Bukit Rigis, Bukit Rigis are the area of intense coffee plantations, consequently, Subhan were a better moisture sources than Bukit Rigis..")
39
Rainfall spatial distributions Over Sumber Jaya catchment The results show that most of the rains started from and had high depth at Subhan Mountain area (West, 1623 m asl). The other moisture sources were Mount Benatan (North, 1688m asl) and Bukit Rigis (Central, 1395 m asl). From geographic position of Sumber Jaya region, Mount Subhan is the highest elevation which face the open ocean at the west of Lampung Province, and behind Subhan is Benatan.
 and Bukit Rigis (Central, 1395 m asl). From geographic position of Sumber Jaya region, Mount Subhan is the highest elevation which face the open ocean at the west of Lampung Province, and behind Subhan is Benatan..")
40
The actual of rain season, when rain sources came from large system (the Indonesian ocean) not just came from local surface heating, occurred on January. It can be tracked from result on January 4 th 2006 when rain covered the whole catchment and consistently the source came from Mount Subhan.

41
Thank you

Similar presentations