Download presentation
Presentation is loading. Please wait.

1
Assessing Information from Multilevel (Ordinal) Tests ROC curves and Likelihood Ratios for results other than “+” or “-” Michael A. Kohn, MD, MPP 10/4/2007

2
Four Main Points 1) Dichotomizing a multi-level test by choosing a fixed cutpoint reduces the value of the test. 2) The ROC curve summarizes the ability of the test to differentiate between D+ and D- individuals. 3) LR(result) = P(result|D+)/P(result|D-) = slope of ROC curve. 4) Pre-Test Odds x LR(result) = Post-Test Odds
 The ROC curve summarizes the ability of the test to differentiate between D+ and D- individuals. 3) LR(result) = P(result|D+)/P(result|D-) = slope of ROC curve. 4) Pre-Test Odds x LR(result) = Post-Test Odds.")
3
Many Tests Are Not Dichotomous Ordinal “-”, “+”, “++”, “+++” for leukocyte esterase on urine dip stick “Normal”, “Low Prob”, “Intermediate Prob”, “High Prob” on VQ scan Continuous Systolic Blood Pressure WBC Count

4
Evaluating the Test --Test Characteristics For dichotomous tests, we discussed sensitivity P(+|D+) and specificity P(-|D-) For multi-level and continuous tests, we will discuss the Receiver Operating Characteristic (ROC) curve
 and specificity P(-|D-) For multi-level and continuous tests, we will discuss the Receiver Operating Characteristic (ROC) curve")
5
Using the Test Result to Make Decisions about a Patient For dichotomous tests, we use the LR(+) if the test is positive and the LR(-) if the test is negative For multilevel and continuous tests, we use the LR(r), where r is the result of the test
 if the test is positive and the LR(-) if the test is negative For multilevel and continuous tests, we use the LR(r), where r is the result of the test")
6
Septic Arthritis Bacterial infection in a joint.

7
Clinical Scenario Does this Adult Patient Have Septic Arthritis?

8
A 48-year-old woman with a history of rheumatoid arthritis who has been treated with long-term, low-dose prednisone presents to the emergency department with a 2-day history of a red, swollen right knee that is painful to touch. She reports no prior knee swelling and no recent trauma or knee surgery, illegal drug use, rash, uveitis, or risky sexual behavior. On examination, she is afebrile and has a right knee effusion. Her peripheral white blood cell (WBC) count is 11 000/µL and her erythrocyte sedimentation rate (ESR) is 55 mm/h. An arthrocentesis is performed, and the initial Gram stain is negative. Margaretten, M. E., J. Kohlwes, et al. (2007). Jama 297(13): 1478-88. You have the synovial white blood cell (WBC) count.
 count is /µL and her erythrocyte sedimentation rate (ESR) is 55 mm/h. An arthrocentesis is performed, and the initial Gram stain is negative. Margaretten, M. E., J. Kohlwes, et al. (2007). Jama 297(13): You have the synovial white blood cell (WBC) count..")
9
Clinical Scenario Does this Adult Patient Have Septic Arthritis? Assume pre-test probability of septic arthritis is 0.38. How do you use the synovial WBC result to determine the likelihood of septic arthritis? Margaretten, M. E., J. Kohlwes, et al. (2007). Jama 297(13): 1478-88.
. Jama 297(13):")
10
Why Not Make It a Dichotomous Test? SynovialSeptic Arthritis WBC Count YesNo >25,000 77% 27% ≤ 25,000 23% 73% TOTAL*100%100% *Note that these could have come from a study where the patients with septic arthritis (D+ patients) were sampled separately from those without (D- patients). Margaretten, M. E., J. Kohlwes, et al. (2007). Jama 297(13): 1478-88.
 were sampled separately from those without (D- patients). Margaretten, M. E., J. Kohlwes, et al. (2007). Jama 297(13):")
11
Why Not Make It a Dichotomous Test? Sensitivity = 77% Specificity = 73% LR(+) = 0.77/(1 - 0.73) = 2.9 LR(-) = (1 - 0.77)/0.73 = 0.32 “+” = > 25,000/uL “-” = ≤ 25,000/uL
 = 0.77/( ) = 2.9 LR(-) = ( )/0.73 = = > 25,000/uL - = ≤ 25,000/uL.")
12
Clinical Scenario Synovial WBC = 48,000/mL (Demonstrate LR Slide Rule?) (Demonstrate Excel?) Pre-test prob: 0.38 LR(+) = 2.9 Post-Test prob = ?
 (Demonstrate Excel ) Pre-test prob: 0.38 LR(+) = 2.9 Post-Test prob =")
13
Clinical Scenario Synovial WBC = 48,000/mL Pre-test prob: 0.38 Pre-test odds: 0.38/0.62 = 0.61 LR(+) = 2.9 Post-Test Odds = Pre-Test Odds x LR(+) = 0.61 x 2.9 = 1.75 Post-Test prob = 1.75/(1.75+1) = 0.64
 = 2.9 Post-Test Odds = Pre-Test Odds x LR(+) = 0.61 x 2.9 = 1.75 Post-Test prob = 1.75/(1.75+1) = 0.64")
14
Clinical Scenario Synovial WBC = 128,000/mL Pre-test prob: 0.38 LR(+) = ? Post-Test prob =?
 = Post-Test prob =")
15
Clinical Scenario Synovial WBC = 128,000/mL Pre-test prob: 0.38 Pre-test odds: 0.38/0.62 = 0.61 LR(+) = 2.9 (same as for WBC=48,000!) Post-Test Odds = Pre-Test Odds x LR(+) = 0.61 x 2.9 = 1.75 Post-Test prob = 1.75/(1.75+1) =.64
 = 2.9 (same as for WBC=48,000!) Post-Test Odds = Pre-Test Odds x LR(+) = 0.61 x 2.9 = 1.75 Post-Test prob = 1.75/(1.75+1) =.64")
16
Why Not Make It a Dichotomous Test? Because you lose information. The risk associated with a synovial WBC=48,000 is equated with the risk associated with WBC=128,000. Choosing a fixed cutpoint to dichotomize a multi- level or continuous test throws away information and reduces the value of the test.

17
Main Point 1: Avoid Making Multilevel Tests Dichotomous Dichotomizing a multi-level or continuous test by choosing a fixed cutpoint reduces the value of the test

18
WBC (/uL) Interval % of Septic Arthritis % of No Septic Arthritis >100,00029%1% >50,000-100,00033%7% >25,000-50,00015%19% 0 - 25,00023%73% TOTAL100%
 Interval % of Septic Arthritis % of No Septic Arthritis >100,00029%1% >50, ,00033%7% >25,000-50,00015%19% ,00023%73% TOTAL100%")
19
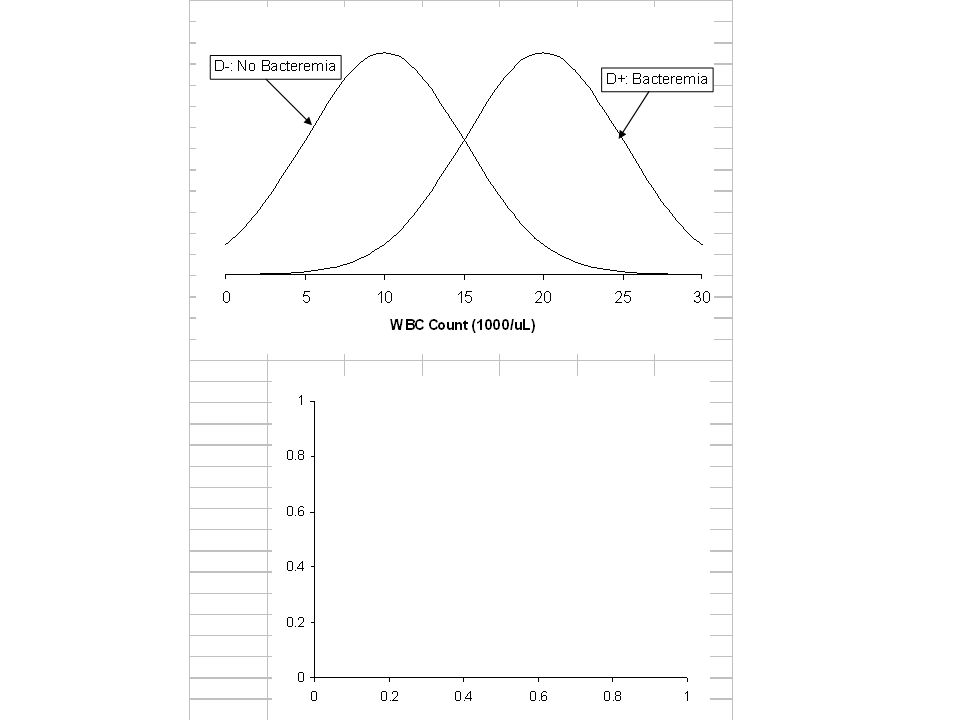
Synovial Fluid WBC Count

20
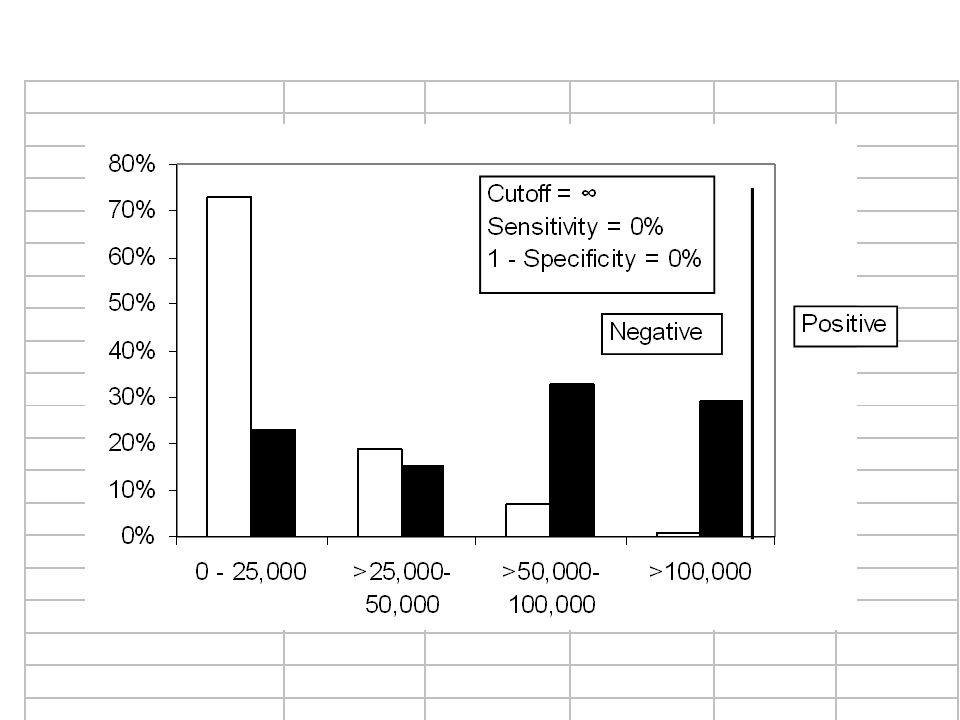
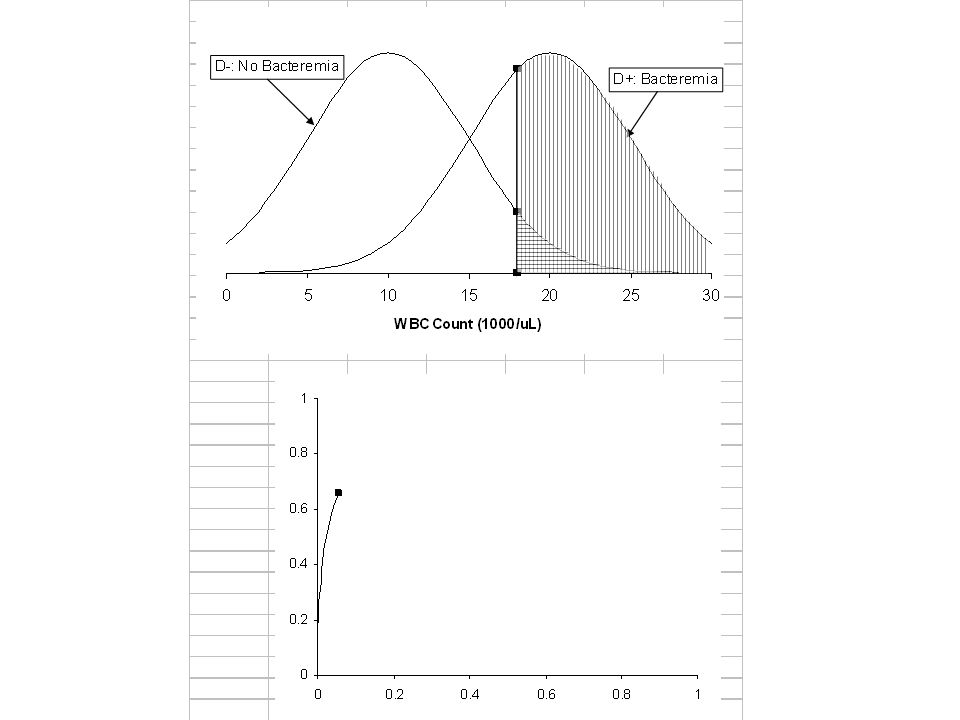
Histogram Does not reflect prevalence of D+ (Dark D+ columns add to 100%, Open D- columns add to 100%) Sensitivity and specificity depend on the cutpoint chosen to separate “positives” from “negatives” The ROC curve is drawn by serially lowering the cutpoint from highest (most abnormal) to lowest (least abnormal).* * Just said that choosing a fixed cutpoint reduces the value of the test. The key issues are 1) the ROC curve is for evaluating the test, not the patient, and 2) drawing the ROC curve requires varying the cutpoint, not choosing a fixed cutpoint.
 the ROC curve is for evaluating the test, not the patient, and 2) drawing the ROC curve requires varying the cutpoint, not choosing a fixed cutpoint..")
26
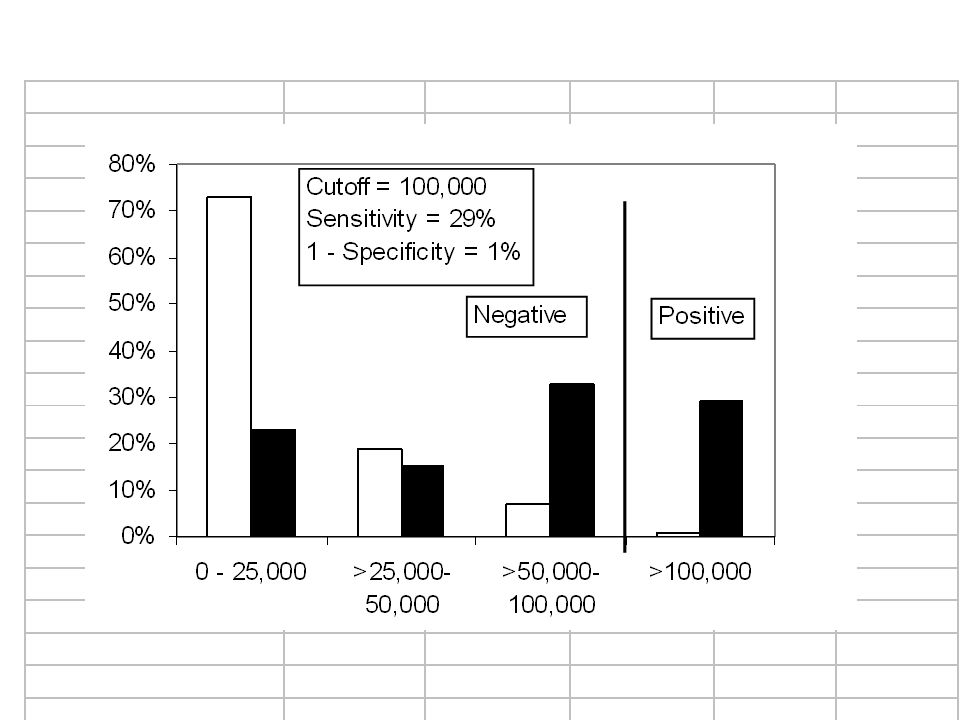
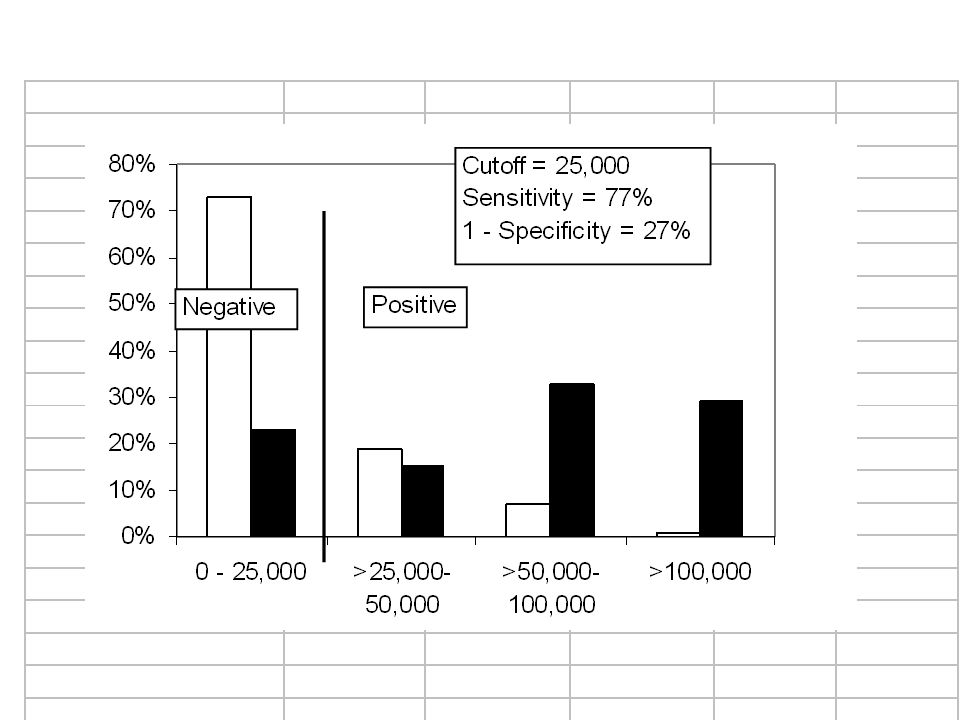
WBC Count (x1000/uL) Sensitivity1 - Specificity > ∞ 0% > 10029%1% > 5062%8% > 2577%27% ≥ 0100% Margaretten, M. E., J. Kohlwes, et al. (2007). Jama 297(13): 1478-88.
. Jama 297(13):")
27
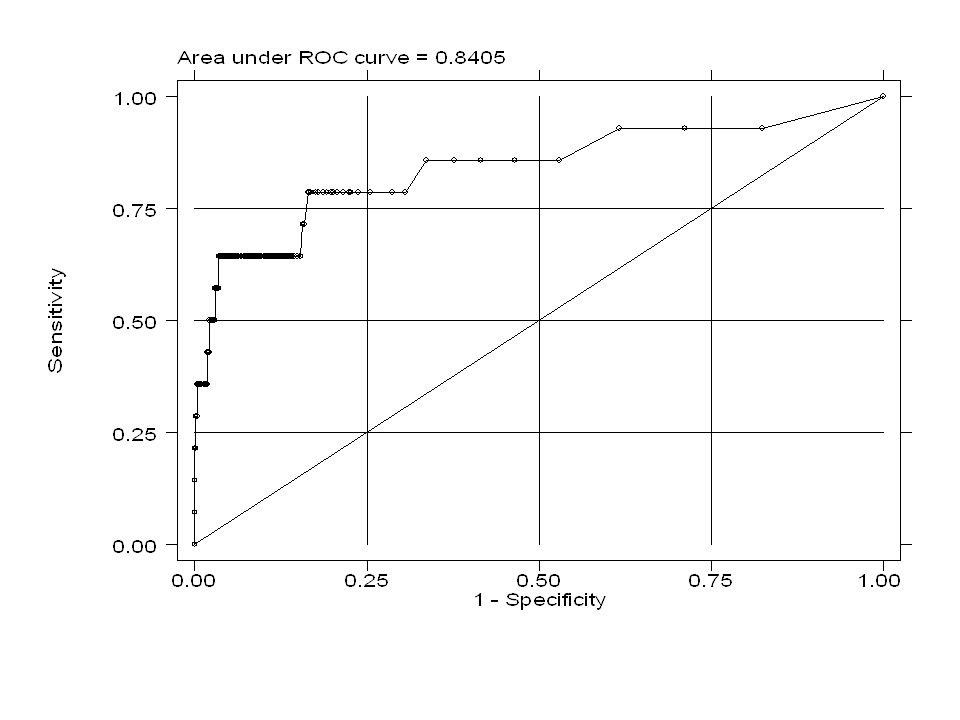
Cutoff > ∞ Cutoff > 100k Cutoff > 50k Cutoff > 25k Cutoff ≥ 0 Area Under Curve = 0.8114

32
Test Discriminates Well Between D+ and D- Test Result D- D+

33
Test Discriminates Well Between D+ and D-

34
Test Discriminates Poorly Between D+ and D- Test Result D- D+

35
Test Discriminates Poorly Between D+ and D-

36
Cutoff > ∞ Cutoff > 100k Cutoff > 50k Cutoff > 25k Cutoff ≥ 0 Area Under Curve = 0.8114 Area Under ROC Curve

37
Summary measure of test’s discriminatory ability Probability that a randomly chosen D+ individual will have a more positive test result than a randomly chosen D- individual

38
Area Under ROC Curve Corresponds to the Mann-Whitney (Wilcoxan Rank Sum) Test Statistic, which is the non-parametric equivalent of Student’s t test. Also corresponds to the “c statistic” reported in logistic regression models

40
“Walking Man” Approach to ROC Curves Divide vertical axis into d steps, where d is the number of D+ individuals Divide horizontal axis into n steps, where n is the number of D- individuals Sort individuals from most to least abnormal test result Moving from the first individual (with the most abnormal test result) to the last (with the least abnormal test result)…
 to the last (with the least abnormal test result)…")
41
“Walking Man” (continued) …call out “D” if the individual is D+ and “N” if the individual is D- Let the walking man know when you reach a new value of the test The walking man takes a step up every time he hears “D” and a step to the right every time he hears “N” When you reach a new value of the test, he drops a stone.
 …call out D if the individual is D+ and N if the individual is D- Let the walking man know when you reach a new value of the test The walking man takes a step up every time he hears D and a step to the right every time he hears N When you reach a new value of the test, he drops a stone.")
42
Synovial WBC Count in 5 Patients with Septic Arthritis Patient WBC Count (x 1000/uL) D1128 D292 D364 D437 D524
 D1128 D292 D364 D437 D524")
43
Synovial WBC Count in 10 Patient Without Septic Arthritis PatientWBC Count (x 1000) N171 N248 N337 N423 N512 N612 N78 N87 N96 N100
 N171 N248 N337 N423 N512 N612 N78 N87 N96 N100")
44
Septic ArthritisNo Septic Arthritis 128 92 71 64 48 37 24 23 12 8 7 6 0

45
DDNDN(DN)DN(NN)NNNN
DN(NN)NNNN")
49
Main Point 2 ROC Curve Describes the Test, Not the Patient Describes the test’s ability to discriminate between D+ and D- individuals Not particularly useful in interpreting a test result for a given patient

50
ROC Curve Describes the Test, Not the Patient Clinical Scenario Synovial WBC count = 48,000 Synovial WBC count = 128,000

51
Synovial WBC count = 48,000

52
Cutoff > ∞ Cutoff > 100k Cutoff > 50k Cutoff > 25k Cutoff ≥ 0

53
Sensitivity, Specificity, LR(+), and LR(-) of the Synovial Fluid WBC Count for Septic Arthritis at 3 Different Cutoffs WBC (/uL)SensitivitySpecificityLR+LR- >100,00029%99%29.00.7 >50,00062%92%7.80.4 >25,00077%73%2.90.3 Synovial WBC Count = 48,000/uL Which LR should we use?
, and LR(-) of the Synovial Fluid WBC Count for Septic Arthritis at 3 Different Cutoffs WBC (/uL)SensitivitySpecificityLR+LR- >100,00029%99% >50,00062%92% >25,00077%73% Synovial WBC Count = 48,000/uL Which LR should we use")
54
Likelihood Ratios LR(+) = Sensitivity/(1 – Specificity) = P(+|D+)/(1-P(-|D-)) = P(+|D+)/P(+|D-) LR(-) = (1 – Sensitivity)/Specificity = (1-P(+|D+))/P(-|D-) = P(-|D+)/P(-|D-)
 = Sensitivity/(1 – Specificity) = P(+|D+)/(1-P(-|D-)) = P(+|D+)/P(+|D-) LR(-) = (1 – Sensitivity)/Specificity = (1-P(+|D+))/P(-|D-) = P(-|D+)/P(-|D-)")
55
Likelihood Ratios LR(result) = P(result|D+)/P(result|D-) P(Result) in patient WITH disease ------------------------------------------------------ P(Result) in patients WITHOUT disease
 = P(result|D+)/P(result|D-) P(Result) in patient WITH disease P(Result) in patients WITHOUT disease")
56
Likelihood Ratios The ratio of the height of the D+ distribution to the height of the D- distribution 15% 19% LR = 15%/19% = 0.8

57
> 50k > 25k 15% 19% Slope = 15%/19% =0.8

58
Likelihood Ratio WBC (/uL) Interval% of D+% of D- Interval LR >100,00029%1%29.0 >50,000-100,00033%7%4.7 >25,000-50,00015%19%0.8 0 - 25,00023%73%0.3
 Interval% of D+% of D- Interval LR >100,00029%1%29.0 >50, ,00033%7%4.7 >25,000-50,00015%19% ,00023%73%0.3")
59
Common Mistake When given an “ROC Table,” it is tempting to calculate an LR(+) or LR(-) as if the test were “dichotomized” at a particular cutoff. Example: LR(+,25,000) = 77%/27% = 2.9 This is NOT the LR of a particular result (e.g. WBC >25,000 and ≤ 50,000); it is the LR(+) if you divide “+” from “-” at 25,000.
 = 77%/27% = 2.9 This is NOT the LR of a particular result (e.g. WBC >25,000 and ≤ 50,000); it is the LR(+) if you divide + from - at 25,000..")
60
WBC (/uL)SensitivitySpecificityLR+LR- >100,00029%99%29.00.7 >50,00062%92%7.80.4 >25,00077%73%2.90.3 Common Mistake
SensitivitySpecificityLR+LR- >100,00029%99% >50,00062%92% >25,00077%73% Common Mistake")
61
27% 77% > 25,000 Common Mistake

62
Main Point 3 Likelihood Ratio P(Result) in patient WITH disease ------------------------------------------------------ P(Result) in patients WITHOUT disease Slope of ROC Curve Do not calculate an LR(+) or LR(-) for a multilevel test.
 in patient WITH disease P(Result) in patients WITHOUT disease Slope of ROC Curve Do not calculate an LR(+) or LR(-) for a multilevel test.")
63
Clinical Scenario Synovial WBC = 48,000/uL Pre-test prob: 0.38 Pre-test odds: 0.38/0.62 = 0.61 LR(WBC btw 25,000 and 50,000) = 0.8 Post-Test Odds = Pre-Test Odds x LR(48) = 0.61 x 0.8 = 0.49 Post-Test prob = 0.49/(0.49+1) = 0.33
 = 0.8 Post-Test Odds = Pre-Test Odds x LR(48) = 0.61 x 0.8 = 0.49 Post-Test prob = 0.49/(0.49+1) = 0.33")
64
Clinical Scenario Synovial WBC = 128,000/uL Pre-test prob: 0.38 Pre-test odds: 0.38/0.62 = 0.61 LR(128,000/uL) = 29 Post-Test Odds = Pre-Test Odds x LR(128) = 0.61 x 29 = 17.8 Post-Test prob = 17.8/(17.8+1) = 0.95
 = 29 Post-Test Odds = Pre-Test Odds x LR(128) = 0.61 x 29 = 17.8 Post-Test prob = 17.8/(17.8+1) = 0.95")
65
Clinical Scenario WBC = 48,000/uL Post-Test Prob = 0.33 WBC = 128,000/uL Post-Test Prob = 0.95 (Recall that dichotomizing the WBC with a fixed cutpoint of 25,000/uL meant that WBC = 48,000/uL would be treated the same as WBC = 128,000/uL and post-test prob = 0.64)
")
66
Main Point 4 Bayes’s Rule Pre-Test Odds x LR(result) = Post-Test Odds What you knew before + What you learned = What you know now
 = Post-Test Odds What you knew before + What you learned = What you know now")
67
Summary 1)Dichotomizing a multi-level test by choosing a fixed cutpoint reduces the value of the test. 2)The ROC curve summarizes the discriminatory ability of the test. 3) LR(result) = P(result|D+)/P(result|D-) = Slope of ROC Curve (NOTE: Do not calculate an LR(+) or LR(-) for a multilevel test.) 4)Pre-Test Odds x LR(result) = Post-Test Odds
The ROC curve summarizes the discriminatory ability of the test. 3) LR(result) = P(result|D+)/P(result|D-) = Slope of ROC Curve (NOTE: Do not calculate an LR(+) or LR(-) for a multilevel test.) 4)Pre-Test Odds x LR(result) = Post-Test Odds.")
68
Calculating the c Statistic In the “walking man” approach to tracing out the ROC curve, the actual values of the test are not important for the shape of the ROC curve or the area under it--only the ranking of the values. The c statistic for the area under an ROC curve is calculated using the same information as the Wilcoxon Rank Sum statistic (or Mann-Whitney U, which is equivalent) and gives identical P values. Non-parametric equivalent of the t test statistic comparing two means.
 and gives identical P values. Non-parametric equivalent of the t test statistic comparing two means..")
69
Septic ArthritisNo Septic Arthritis 128 92 71 64 48 37 24 23 12 8 7 6 0

70
Boxes under Curve = 43.5 Total Boxes = 50 Area Under Curve = 43.5/50 = 0.87

71
BACTEREMIANO BACTEREMIA 1 2 3 4 5 6.5 8 9 10.5 12 13 14 15 S = 21.5 Replace Test Results with Ranks

72
S = 21.5 Smin = d(d+1)/2 = 5(6)/2 = 15 Smax = dn + Smin = 5(10) + 15 = 65 C = (Smax – S) / (Smax – Smin)* = (65 – 21.5) / (65 – 15) = 43.5/50 = 0.87 * Smax – Smin = dn Calculating the C Statistic
/2 = 5(6)/2 = 15 Smax = dn + Smin = 5(10) + 15 = 65 C = (Smax – S) / (Smax – Smin)* = (65 – 21.5) / (65 – 15) = 43.5/50 = 0.87 * Smax – Smin = dn Calculating the C Statistic")
Similar presentations


 Multilevel Tests (Michael) Likelihood ratios for results other than + or ->")

 and Continuous Tests ROC curves and Likelihood Ratios for results other than “+” or “-” Michael A. Kohn,>")


