Download presentation
Presentation is loading. Please wait.

1
Pittsburgh Urban Flash Flood May 18, 1999

4
AMBER Time Display Interval 5-minute ABR: Used to compute ABR Rate and to display 2-hour accumulated ABR.5-minute ABR: Used to compute ABR Rate and to display 2-hour accumulated ABR. 15-minute ABR: Used for comparison with IFLOWS rain gage data and to display 6-hour accumulated ABR.15-minute ABR: Used for comparison with IFLOWS rain gage data and to display 6-hour accumulated ABR. 1-hour ABR: Used for history of ABR in a watershed and to display 24-hour accumulated ABR.1-hour ABR: Used for history of ABR in a watershed and to display 24-hour accumulated ABR.

5
Turtle Creek (1) ABR #1108 18May, 1999 1-hour data
 ABR # May, hour data")
6
Turtle Creek (1) ABR #1108 18-19May, 1999 15-minute data
 ABR # May, minute data")
8
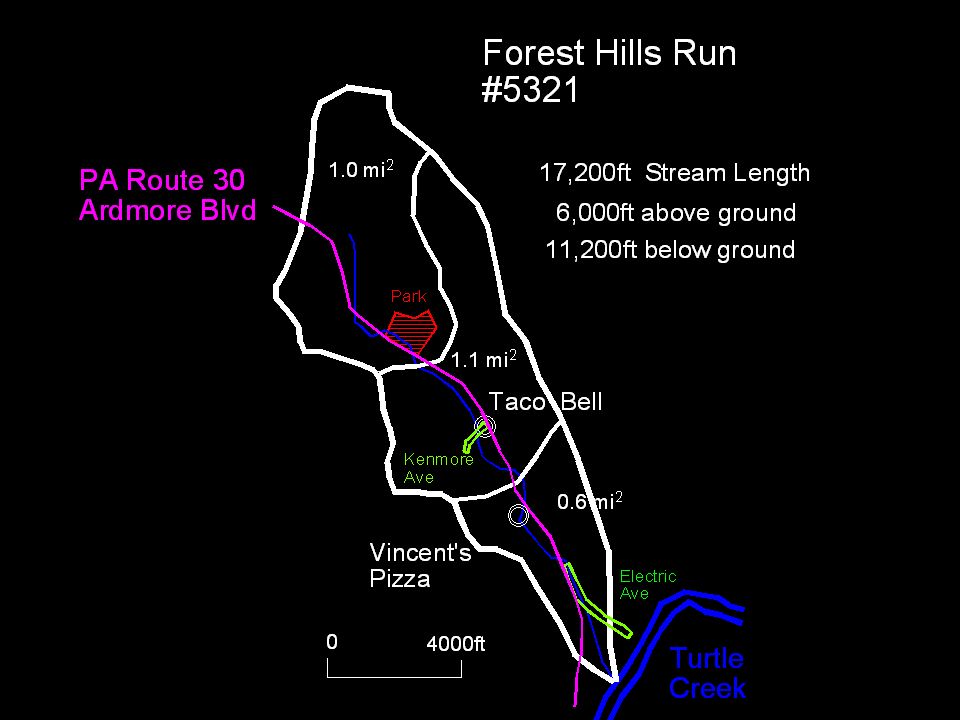
Forest Hills Run ABR #5321 18-19May1999 15 min. data

9
Forest Hills Run ABR #5321 18May1999 5 min. data

11
Forest Hills Run in Park looking downstream.

12
Forest Hills Run exits the park under Route 30.

13
Forrest Hills Run underground. Notice new cement in storm drain. Kenmore Avenue Natural creek channel between Taco Bell and house.

14
Dumpster at Vincent’s Pizza washed 1 mile downstream along Electric Ave. Water and mud damage in building.

15
Electric Ave. Road is built on Forrest Hills Run creek bed, buried underground.

16
Forest Hills EMA Reports 2215 UTC - First reports of water in basements.2215 UTC - First reports of water in basements. 2300 - 0100 UTC many cars stranded along Ardmore Boulevard.2300 - 0100 UTC many cars stranded along Ardmore Boulevard. 0056 UTC - 10/homes/20 people evacuated on Kenmore Avenue.0056 UTC - 10/homes/20 people evacuated on Kenmore Avenue.

18
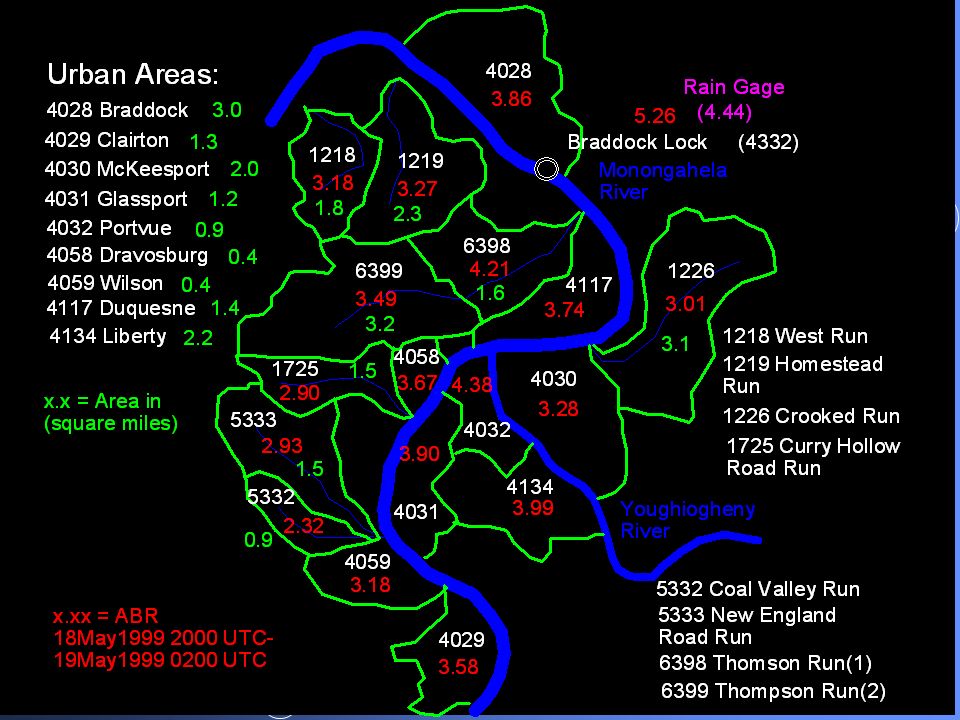
Mon Valley Urban Areas Total population 86,565 Rankin/Braddock 8,256 3.0mi 2Rankin/Braddock 8,256 3.0mi 2 Clairton 12,188 1.3mi 2Clairton 12,188 1.3mi 2 McKeesport 31,012 2.0mi 2McKeesport 31,012 2.0mi 2 Glassport 6,242 1.2mi 2Glassport 6,242 1.2mi 2 Port Vue 5,316 0.9mi 2Port Vue 5,316 0.9mi 2 Wilson/Dravosburg 11,075 0.8mi 2Wilson/Dravosburg 11,075 0.8mi 2 Duquesne 10,094 1.4mi 2Duquesne 10,094 1.4mi 2 Liberty 3,112 2.2mi 2Liberty 3,112 2.2mi 2

19
Port Vue #4032 0.9mi 2 18-19May1999 15 min. data

20
Port Vue #4032 0.9mi 2 18May1999 5 min. data

21
Rankin/Braddock #4028 3.0mi 2 18-19May1999 15 min. data

22
Rankin/Braddock #4028 3.0mi 2 18May1999 5 min. data

23
Liberty #4134 2.2mi 2 18-19May1999 15 min. data

24
Liberty #4028 2.2mi 2 18May1999 5 min. data Liberty #4028 2.2mi 2 18May1999 5 min. data

25
Duquesne #4117 1.4mi 2 18-19May1999 15 min. data

26
Duquesne #4117 1.4mi 2 18May1999 5 min. data

27
Clairton #4029 1.3mi 2 18-19May1999 15 min. data

28
Clairton #4029 1.3mi 2 18May1999 5 min. data Clairton #4029 1.3mi 2 18May1999 5 min. data

29
AMBER’sSlidingTime Window AMBER’s Sliding Time Window AMBER gives the forecaster the option of examining rainfall in any time duration.AMBER gives the forecaster the option of examining rainfall in any time duration. The capability of examining rainfall in a moving time window is a very powerful feature for the flash flood forecaster.The capability of examining rainfall in a moving time window is a very powerful feature for the flash flood forecaster. One inch of rain falling in 15 minutes produces a much large stream response than one inch of rain distributed through 1 hour.One inch of rain falling in 15 minutes produces a much large stream response than one inch of rain distributed through 1 hour.

30
Clairton #4029 1.3mi 2 18May1999 5 min. data

31
Clairton #4029 1.3mi 2 18May1999 5 min. data Clairton #4029 1.3mi 2 18May1999 5 min. data

32
24 Hour ABR-Rainfall History The history of previous rainfall in a watershed is invaluable in determing flash flood potential.The history of previous rainfall in a watershed is invaluable in determing flash flood potential. The AMBER 24 hour rainfall product can be used to quickly determine the rainfall distribution in any watershed for the past 24 hours.The AMBER 24 hour rainfall product can be used to quickly determine the rainfall distribution in any watershed for the past 24 hours. ABR is displayed in one hour increments.ABR is displayed in one hour increments.

33
Clairton #4029 1.3mi 2 18May1999 1 hour data Clairton #4029 1.3mi 2 18May1999 1 hour data

34
Glassport #4031 1.2mi 2 18-19May1999 15 min. data

35
Glassport #4031 1.2mi 2 18May1999 5 min. data

36
Thompson Run(1) #6398 1.6mi 2 18-19May1999 15 min. data
 # mi May min. data")
37
Thompson Run(1) #6398 1.6mi 2 18May1999 5 min. data
 # mi 2 18May min. data")
38
Thompson Run(2) #6399 3.2mi 2 18-19May1999 15 min. data
 # mi May min. data")
39
Thompson Run(2) #6399 3.2mi 2 18May1999 5 min. data
 # mi 2 18May min. data")
40
Braddock Lock 2 ABR #4332 18-19May1999 15 min. data

41
Braddock Lock 2 ABR #4332 18May1999 5 min. data

42
Conclusions Small watersheds definition is the key to detection of flash flooding.Small watersheds definition is the key to detection of flash flooding. ABR Rate gives early warning for flash flood potential.ABR Rate gives early warning for flash flood potential. Time duration of rainfall display impacts forecaster perception of flash flood threat.Time duration of rainfall display impacts forecaster perception of flash flood threat. User selectable time window needed.User selectable time window needed.

Similar presentations


 Program A Tool to Assist in Flash Flood Forecasting Ami Arthur Cooperative Institute for Mesoscale Meteorological.>")


 Urbanization ERS 482/682 Small Watershed Hydrology.>")


