Download presentation
Presentation is loading. Please wait.

1
www.bsc.es Belgrade, 25 September 2014 George S. Markomanolis, Oriol Jorba, Kim Serradell Performance analysis Tools: a case study of NMMB on Marenostrum Supercomputer

2
Outline 2 Introduction to Paraver Examples with NMMB/BSC-CTM Various Paraver views Configuration of Extrae tool Summary 2

3
Tools 3 Since 1991 Based on traces Open source: http//:www.bsc.es/paraver Core tools: Paraver Extrae Dimemas 3

4
Paraver 4 Every behavioral aspect/metric described as a function of time Those functions of time can be rendered into a 2D image Statistics can be computed for each possible value or range of values of that function of time 4

5
Extrae 5 BSC instrumentation package When/Where Parallel programming model runtime Selected user functions Periodic samples User events Additional information Counters 5

6
Timelines 6 Representation Function of time Colour encoding 6

7
Paraver – Generic View 7 7 Part of the timeline Colours for different events Example for 68 MPI processes 1 hour global domain, 24km, 64 layers, meteo configuration

8
Paraver – Menu (from BSC Tools presentation) 8 8
 8 8")
9
Paraver – Load configuration (from BSC Tools presentation) 9 9
 9 9")
10
Paraver – Menu (from BSC Tools presentation) 10
 10")
11
Paraver – Profiles (from BSC Tools presentation) 11
 11")
12
Paraver – Profiles (from BSC Tools presentation) 12
 12")
13
Paraver – Histograms (from BSC Tools presentation) 13
 13")
14
Paraver – Histograms (from BSC Tools presentation) 14
 14")
15
Paraver –View 15 Running and observing the events Computation

16
Paraver – Computation View 16 Create a profile view for the following part of the trace

17
Paraver – Profile View 17 Create a profile view for the following part of the trace

18
Paraver – Profile View 18 Percentage of MPI calls Average=98.7% is the parallel efficiency Maximum = 99.98% is the communication efficiency Avg/max = 0.99 is perfect load balanced only for this part of the trace

19
Paraver – Useful Duration 19 Part of the timeline 1 hour global domain, 24km, 64 layers, meteo configuration Green low computation, blue significant computation (useful duration view)
")
20
Paraver – Time histogram 20 For better load balancing is needed to have vertical lines

21
Paraver – Instructions histogram 21 The computation is not uniform

22
Paraver – Instructions per cycle (IPC) 22 Efficient computation Useful efficient computation
 22 Efficient computation Useful efficient computation")
23
Paraver – Useful computation histogram 23

24
Paraver – Useful time histogram 24

25
Paraver – Useful IPC histogram 25

26
Paraver – Useful L2 cache miss hit ratio 26 Per user function Table

27
Paraver – MPI calls 27 MPI calls excluding computation MPI calls with partial communication visualization

28
Paraver – Total bytes sent 28

29
Paraver – Max bytes sent 29

30
Paraver – Percentage of MPI time per user function 30

31
Paraver – Communication matrix 31

32
MPI – Send a message 32

33
Paraver – User functions 33 User functions Useful user functions

34
Paraver – Global – 24km - Meteo Simulation: 02/12/2005

35
Paraver – Global – 24km – Meteo – between radiations

36
Paraver – Global – 24km – Meteo – radiation

37
Communication matrix

38
Paraver – Global – 24km – Meteo/Dust/Chem Simulation: 21/05/2010

39
Paraver – Global – 24km – Meteo/Dust/Chem Simulation: 21/09/2010

40
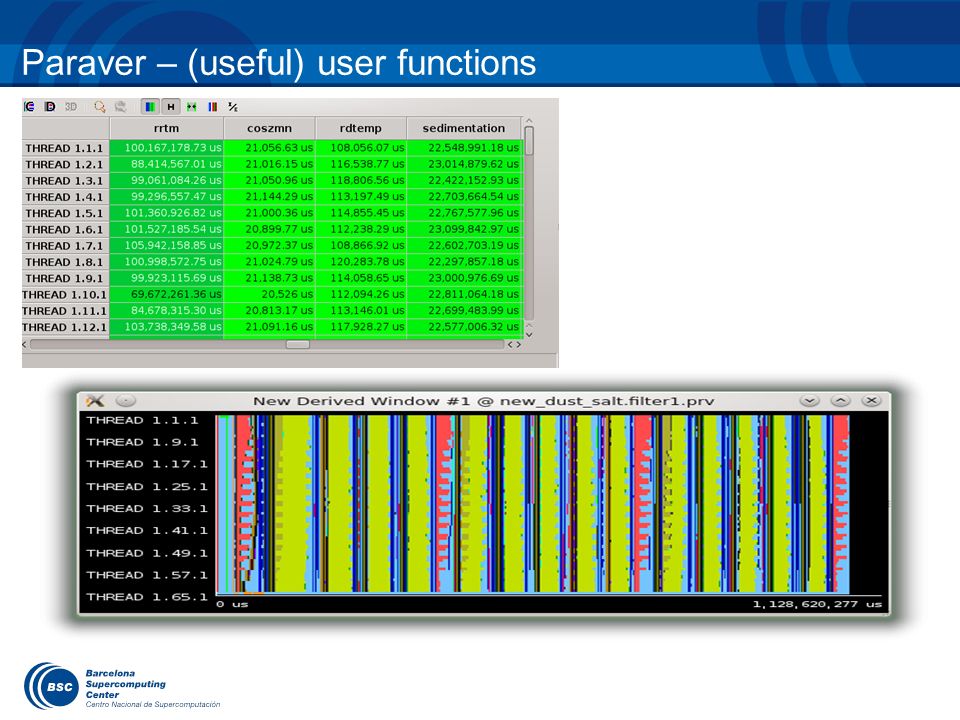
Paraver – (useful) user functions
 user functions")
42
Computation load imbalance

43
Zoom between radiation calls for dust/sea-salt

44
Extrae 44 How to use: mpirun … wrapper.sh /path/umo.x Contents of wrapper.sh file: export EXTRAE_HOME=/installation_path/ export LD_PRELOAD=/installation_path/lib/libmpitrace.so export LD_LIBRARY_PATH=$LD_LIBRARY_PATH:/installation_path/lib source ${EXTRAE_HOME}/etc/extrae.sh export EXTRAE_CONFIG_FILE=/path/extrae_config.xml $*

45
</trace enabled=“yes” … PAPI_TOT_INS,PAPI_TOT_CYC 1000000 … <merge enabled=“yes” … > $TRACE_NAME$ Extrae – XML file 45

46
Summary 46 The performance analysis of an application is a long and sometimes difficult task We used Extrae/Paraver to analyze our model Performance tools are needed more and more! Hardware counters are important to study the computation phases Load imbalance issues are well known to the community but need to be studied We identified some serialization issues Extrae needs to be properly configured

47
www.bsc.es Thank you! Questions? 47

Similar presentations


 Unique Chips and Systems (UCAS-4) Dimitris Kaseridis & Lizy K. John The.>")
>")


![Authors: Tong Li, Dan Baumberger, David A. Koufaty, and Scott Hahn [Systems Technology Lab, Intel Corporation] Source: 2007 ACM/IEEE conference on Supercomputing.](/22/6365489/big_thumb.jpg "Authors: Tong Li, Dan Baumberger, David A. Koufaty, and Scott Hahn [Systems Technology Lab, Intel Corporation] Source: 2007 ACM/IEEE conference on Supercomputing.>")

