Download presentation
Presentation is loading. Please wait.

2
A Bottom-Up Modelling Perspective on Representativeness: The Example of PIXGRO Europe J. Tenhunen

3
MODLAND Sinusoidal Grid10 degree Tiles 10 degree Tiles Data Sources: DAO Radiation, Temperature, Precipitation USGS DEM, USGS Eurasia Land Cover European Soil Data Base JRC Country Mask MODIS LAI or other layers Conversion to sinusoidal projection GRASS Output in 1 km raster Cut to size Regridded to 10 km Substructure recorded PVWAVE Separate model runs for different landuse Final numbers come from post- processing Data Preparation Why 17? Process Controls!

5
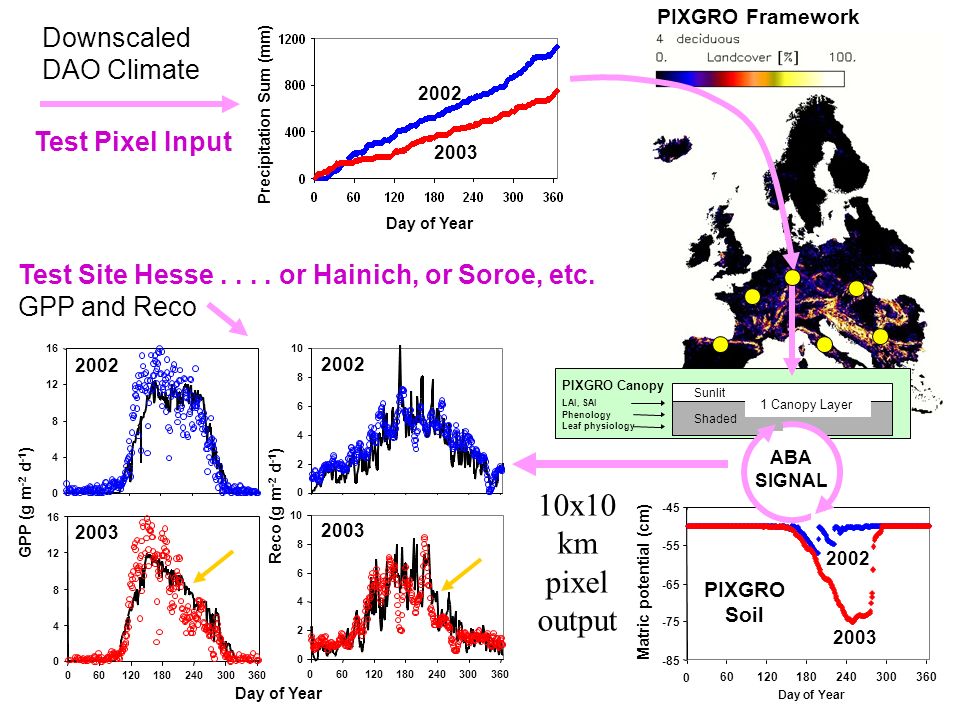
Day of Year Downscaled DAO Climate LAI, SAI Phenology Leaf physiology Sunlit Shaded 1 Canopy Layer PIXGRO Canopy Day of Year 2003 2002 2003 2002 ABA SIGNAL PIXGRO Soil 0 4 8 12 16 0 2 4 6 8 10 0 2 4 6 8 060120180240300360 060120180240300360 0 4 8 12 16 Test Site Hesse.... or Hainich, or Soroe, etc. GPP and Reco GPP (g m -2 d -1 ) Reco (g m -2 d -1 ) Day of Year Precipitation Sum (mm) Test Pixel Input PIXGRO Framework 10x10 km pixel output 2002 2003 Matric potential (cm)
 Reco (g m -2 d -1 ) Day of Year Precipitation Sum (mm) Test Pixel Input PIXGRO Framework 10x10 km pixel output Matric potential (cm).")
6
100 / 17 = 5.88 5.88 is currently ca. 1 to 5 5.88 is really minimal with respect to long-term adjustments and acclimation response Test Pixel Math

7
subarctic alpine dry deciduous forests shrublands

9
At these locations, the problem is one of understanding the basic process response for carbon exchange but also water exchange, soil water depletion, and the influences of hydrology and seasonal climate on phenology.

11
Vegetation, both potential and actual, is the best indicator of process controls. Sample according to vegetation, including the extremes and maxima in development, and particularly interesting regions. Add in landuse change and disturbance and be satisfied for the first project in order to obtain temporal variation.

Similar presentations


 FOREST IN ITALY UNDER COPPICE MANAGEMENT Luca Belelli.>")
 Kirsten de Beurs.>")


, snow water equivalent (SWE), soil freeze and vegetation status from satellite information,>")


 Input ParameterUnited.>")


. The background is a false-color Landsat mosaic from 2000. The area of Rwanda is 26,798 km 2, but.>")

