Download presentation
Presentation is loading. Please wait.

1
Yellowtail Dam & Bighorn Lake 2010 Operation Review Billings, MT January 2011 RECLAMATION Managing Water in the West

2
2010 Bighorn Lake Operations Using the Draft Criteria “A Yo Yo Year”

3
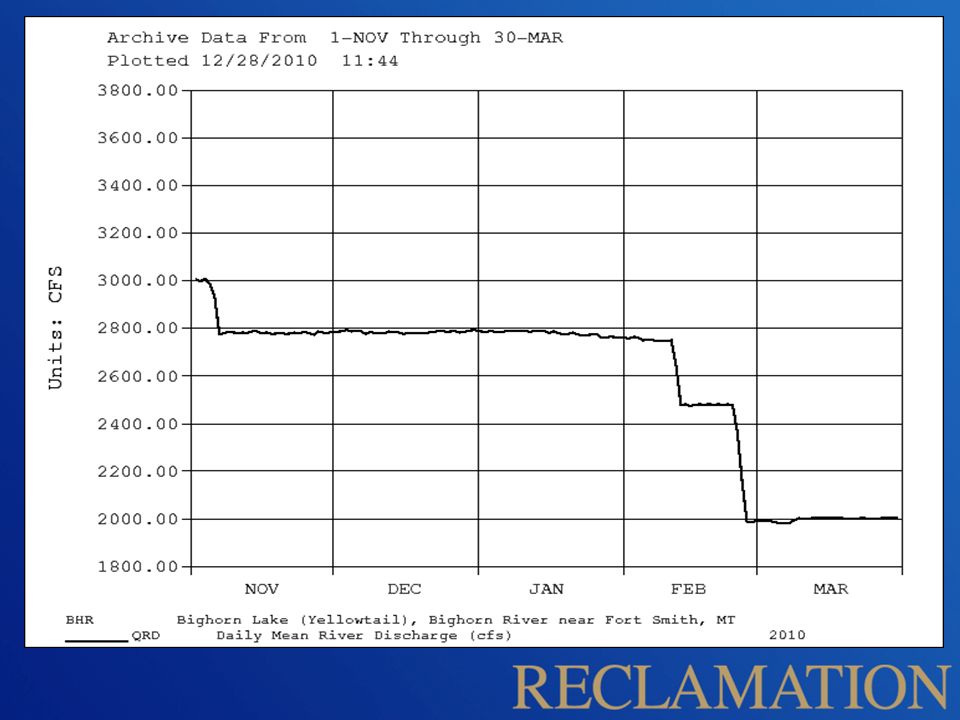
November – March Period Nov-Mar parameters used for calculating release rate April-Oct. gain = 265,000 AF End of Oct. storage =1,064,000 AF (Elev. 3639.5) Boysen planned release =900 CFS Buffalo Bill planned release =360 CFS Based on above Nov-Mar Release set at 2750 cfs
 Boysen planned release =900 CFS Buffalo Bill planned release =360 CFS Based on above Nov-Mar Release set at 2750 cfs.")
4
Bighorn River Release Rate NOVEMBER - MARCH ABCDEFGHI ENTERCALCULATEDENTER InitialCALCULTEDCALCULATEDTARGET ELEV Bighorn Lake Nov-MarBighorn LakeBuffalo BillBoysen Res31-Mar Release toRiver Release31-Mar Apr-Oct GainForecasted GainOct. 31 StoragePlanned Nov-Mar Stor TargetAfterbayFrom AfterbayReservoir acre-feet Release Avg cfs acre-feetcfs Target Elevation 265,000247,3391,064,000360900858,4422705 27753620.6 3639.5 Sample Data Water Year -183,920 799,574 2005002007 37,096 991,906 1504002008 237,341 1,060,3003727002009 265,425 1,063,7703689002010 DIRECTIONS: Enter appropriate data under A, C, D, and E (Yellow Cells A10, C10, D10 and E10). RIVER RELEASE: The release to the river for November - March. is calculated under H (cell H10) TARGET ELEVATION: The March 31 taget elevation is shown under I (cell I10)
. RIVER RELEASE: The release to the river for November - March. is calculated under H (cell H10) TARGET ELEVATION: The March 31 taget elevation is shown under I (cell I10).")
5
Forecasted Nov. – Mar. Inflow acre-feet Forecasted Actual Forecast % of Actual 2010625,900 646,500 97% 2009 560,600 580,500 97% 2008 382,600 382,571 100%

6
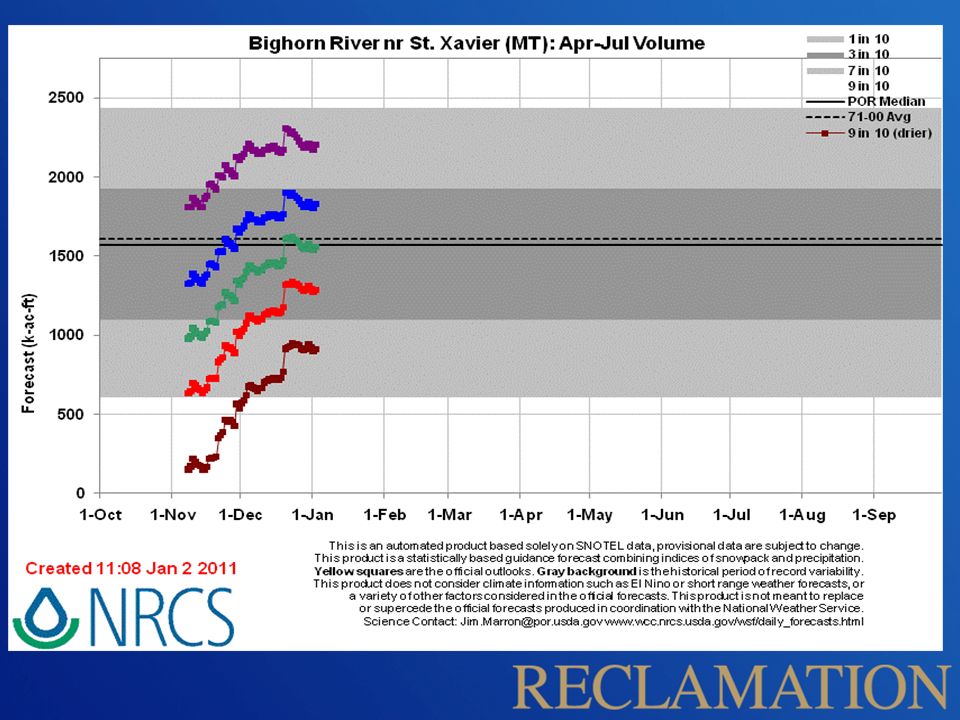
February– March Period “Down It Goes” February 1 Apr-Jul Forecast 634,200 AF57% March 1 Apr-July Forecast591,000 AF53% Minimum Forecast for Rule curve719,000 AF64% Under minimum rule curve a release of 2,000 cfs is needed

9
Apr-July Rule Curve Analysis “Up She Goes” Apr 1 April-July Inflow Forecast 625,000 AF 56% Apr 15 April-July Inflow Forecast 730,000 AF 65% Based on the April 15 Forecast being greater than 719,000 AF a rule curve was prepared

13
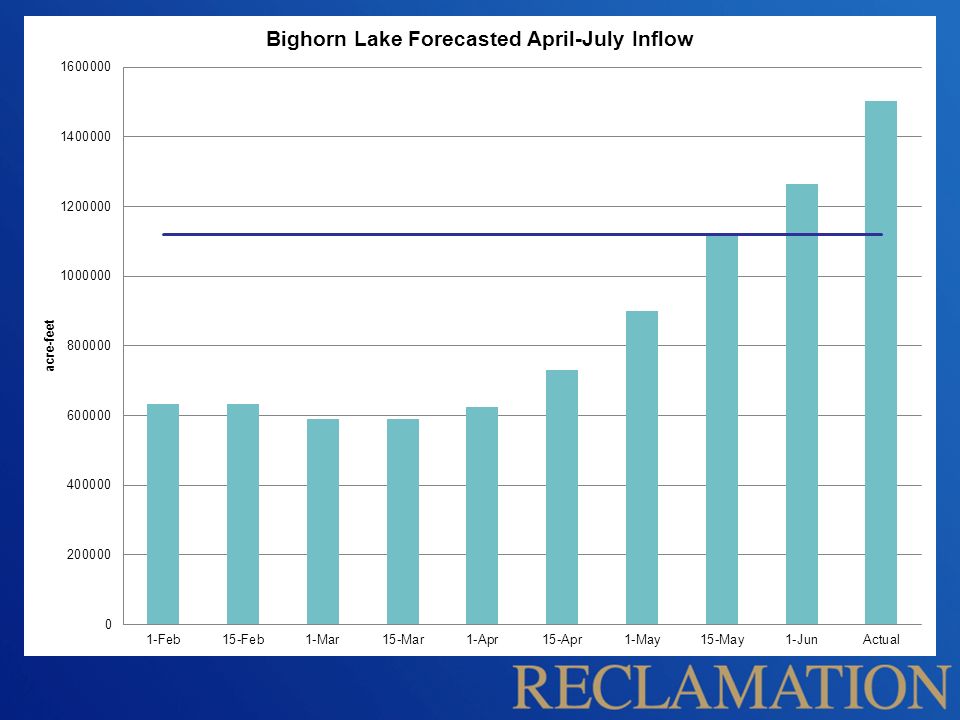
Spring Runoff Forecasts April-July Inflow % of DateForecast (ac-ft)Average Feb. 1 634,000 57% Mar. 1 591,000 53% Apr. 1 625,000 56% Apr. 15 730,000 65% May 1 900,400 81% May 151,121,400101% June 11,263,300113% Actual1,504,354135%

14
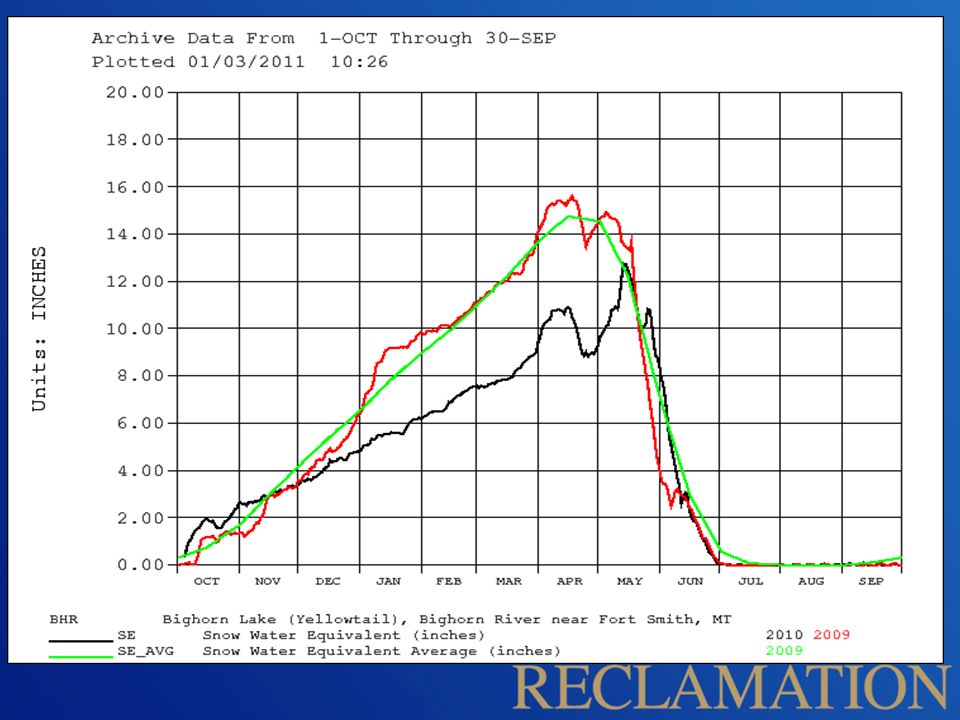
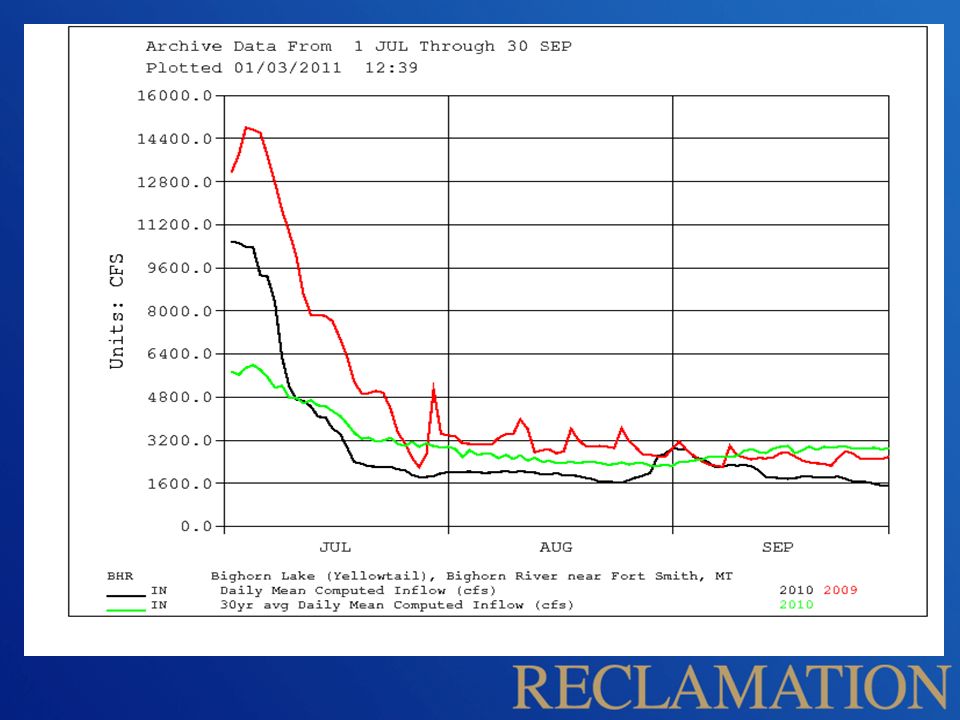
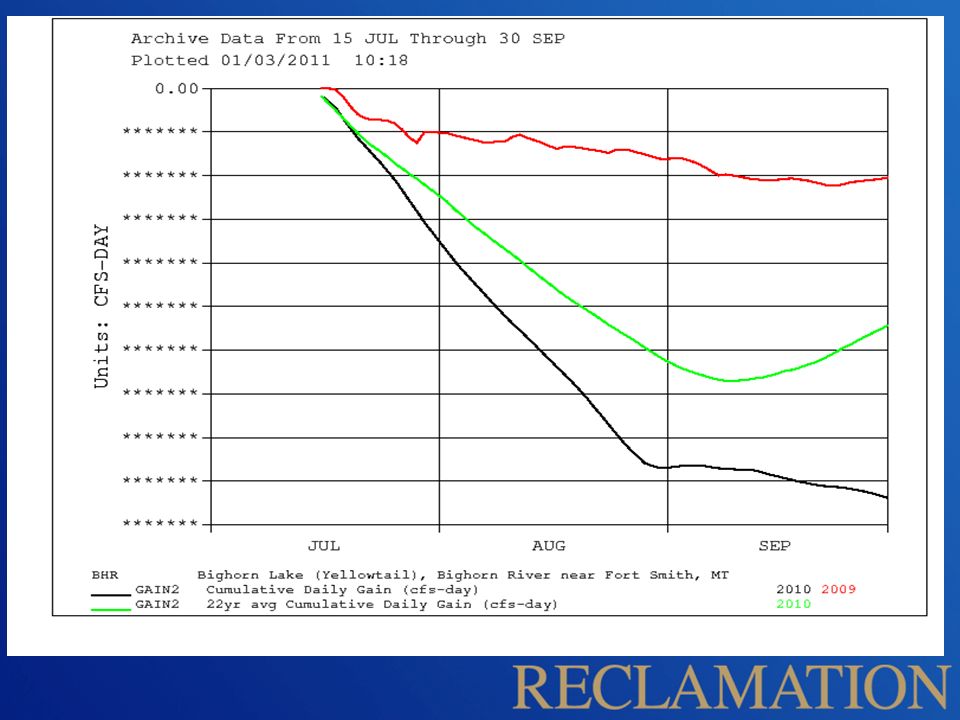
August-October Period “and Down Again” Inflows dropped sharply during the 2 nd haft of July and continued to drop and remain low through the end of October. Since most of the snow occurred in the spring it melted rapidly reducing snowpack to supply late summer flows. August –October were unusually dry and warm reducing runoff and increasing irrigation depletions. August –October gains to Bighorn Lake were -53,000 AF compared to an average of 35,800 AF, 88,800 AF less than average.

16
August-October Gains Actual 2010 Aug-Oct Gains = -53,000 AF Average Aug-Oct Gains = 35,800 AF Difference = 88,800 AF In CFS this difference is 490 CFS Lowest Gains of Record

18
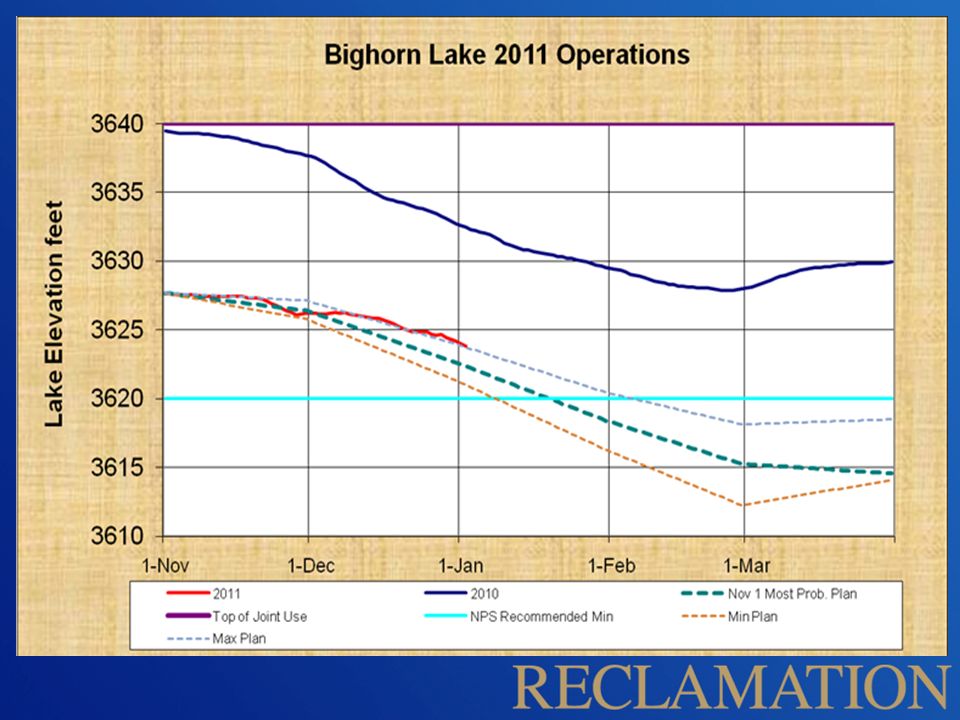
November – March 2011 Nov-Mar Parameters used for calculating Release Rate 20112010 April-Oct. Gain = 201,000 AF265,000 AF End of Oct. Storage = 938,000 AF 1,064,000 AF Boysen Planned Release 800 CFS 900 CFS Buffalo Bill Planned Release 355 CFS 360 CFS Nov-Mar Release2,370 CFS 2,750 CFS

22
QUESTIONS & COMMENTS

23
March 31 Target Elevation Target elevation determined on November 1 prior to accumulation of snowpack in the mountains. Target elevation is set at a level that will handle both high and low spring runoff Reservoir level is adjusted by March 31 based on forecasts to deal with expected runoff. Reservoir allowed to gradually fill with average to below average forecasts and to be further drafted with above average forecasts

24
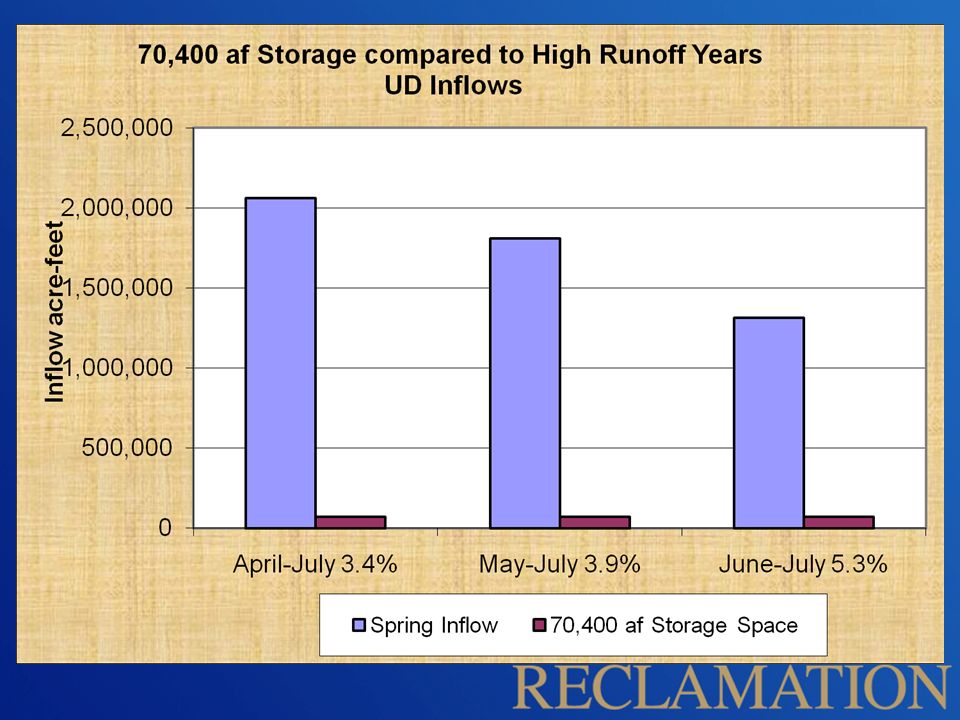
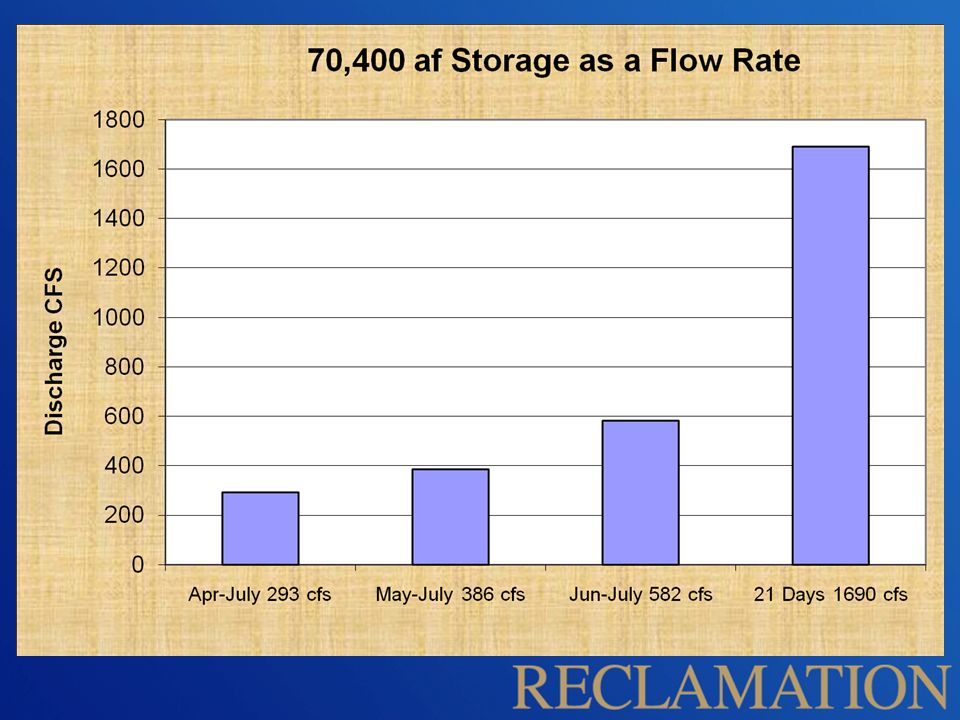
Target Elev. 3620 Compared to 3610 Lake ElevationStorage af 3620 873,600 af 3610 803,200 af Diff. 10 70,400 af 3645.2 1,140,399 af 3640.0 1,070,029 af Diff. 5.2 70,370 af

30
QUESTIONS

31
PEAK BIGHORN RIVER DISCHARGE YearActual PeakEst. With Rule Curve 199514,000 CFS12,000 CFS 199711,000 CFS12,000 CFS 199910,000 CFS12,000 CFS 200912,500 CFS11,000 CFS

32
PEAK BIGHORN LAKE ELEVATION YearActual Est. With Peak Rule CurveDifference 19953646.33645.6-0.7 19973651.73643.9-7.8 19993649.33641.5-7.8 20093647.93645.5-2.4

33
PROPOSED RESERVOIR TARGETS Date Existing Proposed Difference _______ Targets Targets (feet) Oct 31 3635 3638-40 +3-5 ft Nov 30 3630Eliminated+5-7 ft Mar 31 3605-14 3617-21 +7-13 ft July 31 3640 3640 Same
 Oct ft Nov Eliminated+5-7 ft Mar ft July Same")
37
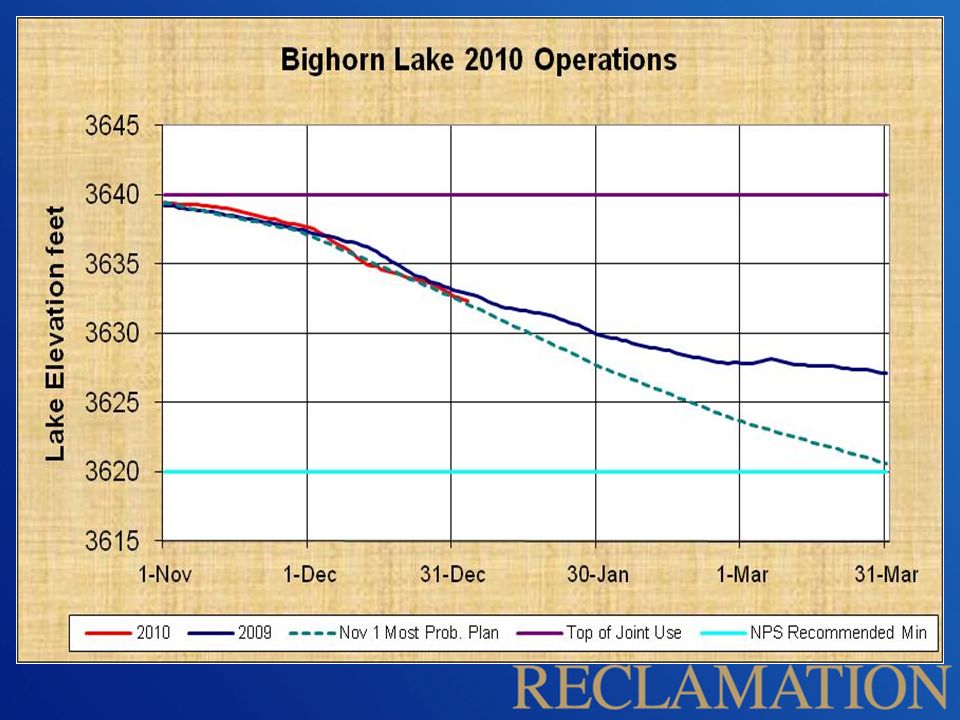
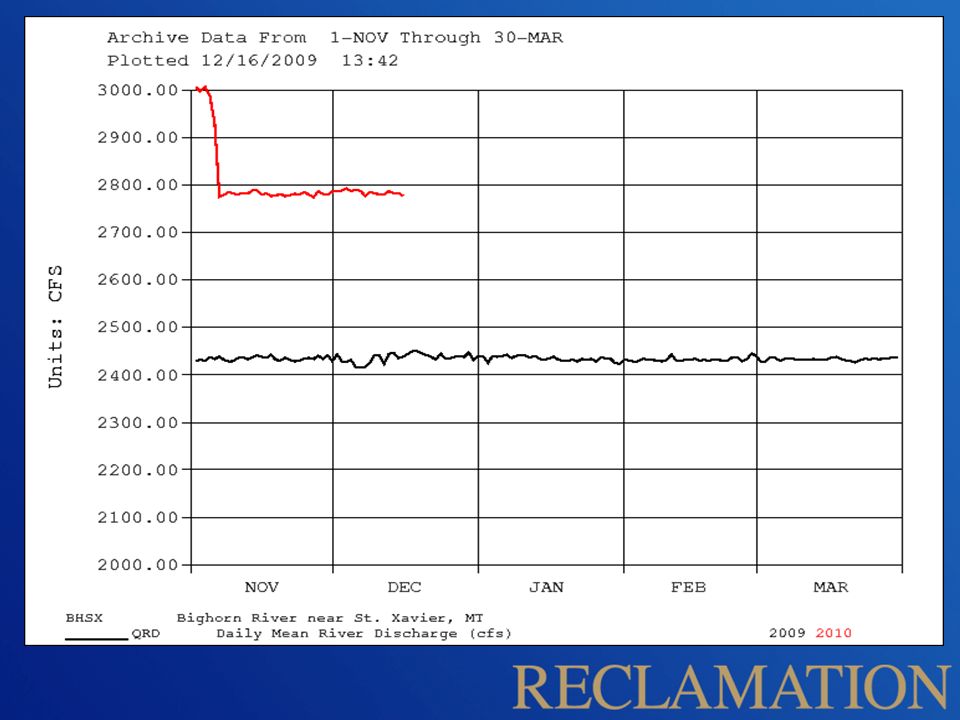
Nov.-Mar. Operations Bighorn River release rate - 2775 cfs River discharge 275 cfs above 2500 cfs March 31 Bighorn Lake target level – 3620.6 feet Current Lake Level – 36??

40
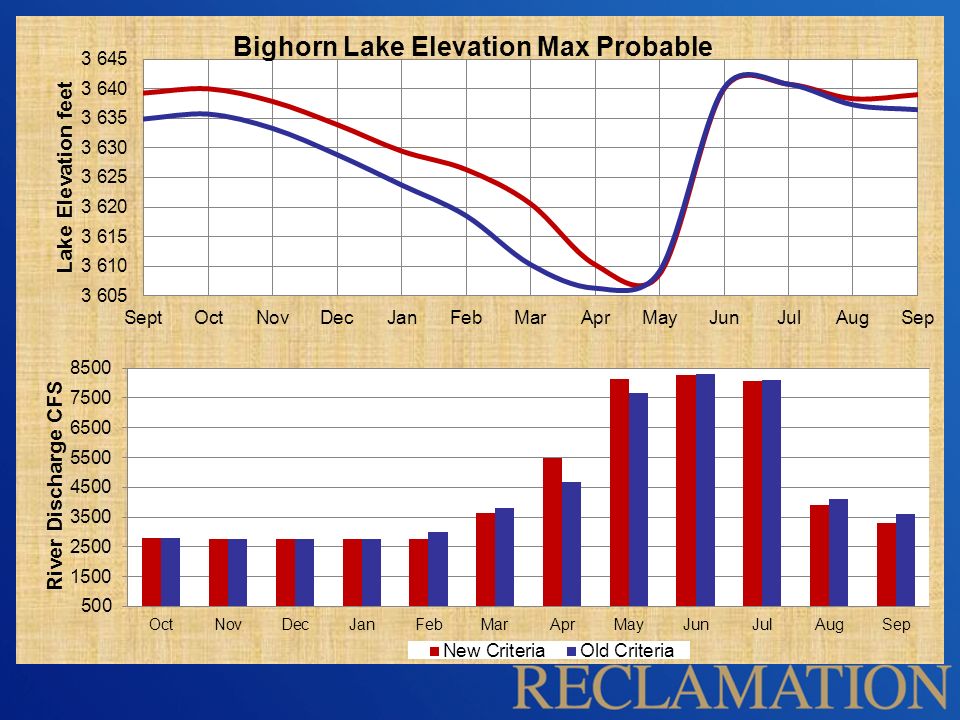
2010 Forecasted Rule Curve

41
QUESTIONS & COMMENTS

Similar presentations