Download presentation
Presentation is loading. Please wait.

1
NOAA California Energy Security Project Tim P. Barnett David W. Pierce Anne Steinemann Eric Alfaro Alexander Gershunov Scripps Inst. of Oceanography La Jolla, CA Dennis Lettenmaier Alan Hamlet Nathalie Voisin University of Washington Seattle, WA Mary Altalo Todd Davis Monica Hale SAIC San Diego, CA

2
Project Overview Scripps Inst. Oceanography University of Washington Georgia Inst. Tech California Energy Commission California ISO PacifiCorp San Diego Gas & Elec. SAIC Academia State Partners Industrial Partners

3
Project Objective Determine the economic value of climate and weather forecasts to the energy sector

4
Why aren’t climate forecasts used? Climate forecasts are probabilistic in nature – sometimes unfamiliar to the user Lack of understanding of climate forecasts and their benefits Language and format of climate forecasts is hard to understand – need to be translated for end-users Aversion to change – easier to do things the traditional way

5
CPC Seasonal Outlooks

6
Importance of Stakeholder Involvement Identify potential uses and benefits of forecast information Develop forecasts to meet user needs Deliver and discuss products with stakeholders Obtain feedback from stakeholders and iterate Integrate forecasts with decision-making

7
Key stakeholder questions What types of forecast information could help with decision-making? What are the specifications for desired forecasts? What are the organizational incentives and barriers to forecast use? What are the potential benefits and costs of using the forecast information?

8
Case studies 1.California delta breeze 2.Peak day load forecasting 3.Irrigation pump loads 4.California summer temperatures 5.Hydropower

9
1. California "Delta Breeze" An important source of forecast load error (CalISO) Big events can change load by 500 MW (>1% of total) Direct cost of this power: $250K/breeze day (~40 days/year: ~$10M/year) Indirect costs: pushing stressed system past capacity when forecast is missed!
 Big events can change load by 500 MW (>1% of total) Direct cost of this power: $250K/breeze day (~40 days/year: ~$10M/year) Indirect costs: pushing stressed system past capacity when forecast is missed!.")
10
NO delta Breeze Sep 25, 2002: No delta breeze; winds carrying hot air down California Central valley. Power consumption high.

11
Delta Breeze Sep 26, 2002: Delta breeze starts up; power consumption drops >500 MW compared to the day before!

12
Weather forecasts of Delta Breeze 1-day ahead prediction of delta breeze wind speed from ensemble average of NCEP MRF, vs observed.

13
Statistical forecast of Delta Breeze (Also uses large- scale weather information) By 7am, can make a determination with >95% certainty, 50% of the time
 By 7am, can make a determination with >95% certainty, 50% of the time")
14
Dennis Gaushell, Cal-ISO

15
Cost of forecast errors

16
Delta Breeze summary Using climate information can do better than dynamic weather forecasts Possible savings of 10 to 20% in costs due to weather forecast error. Depending on size of utility, will be in range of high 100,000s to low millions of dollars/year.

17
2. Load demand management Induce customers to reduce electrical load on peak electrical load days Prediction challenge: call those 12 days, 3 days in advance Amounts to calling weekdays with greatest "heat index" (temperature/humidity)
.")
18
Why shave peak days? http://www.energy.ca.gov/electricity/wepr/2000-07/index.html

19
Price vs. Demand http://www.energy.ca.gov/electricity/wepr/1999-08/index.html

20
July SundayMondayTuesdayWednesdayThursdayFridaySaturday 1 2990 MW 79 F 2 3031 MW 81 F 3 3389 MW 88 F 4 2958 MW 85 F 5 67 2814 MW 71 F 8 2766 MW 73 F 9 2791 MW 75 F 10 2906 MW 79 F 11 3106 MW 83 F 12 1314 3130 MW 76 F 15 3089 MW 74 F 16 3046 MW 84 F 17 3102 MW 77 F 18 2888 MW 78 F 19 2021 3317 MW 82 F 22 2867 MW 73 F 23 3055 MW 77 F 24 2991 MW 73 F 25 3006 MW 75 F 26 2728 2935 MW 78 F 29 3165 MW 82 F 30 3398 MW 86 F 31 3176 MW 78 F Average = 2916 MW

21
July SundayMondayTuesdayWednesdayThursdayFridaySaturday 1 2990 MW 79 F 2 3031 MW 81 F 3 3389 MW 88 F 4 2958 MW 85 F 5 67 2814 MW 71 F 8 2766 MW 73 F 9 2791 MW 75 F 10 2906 MW 79 F 11 3106 MW 83 F 12 1314 3130 MW 76 F 15 3089 MW 74 F 16 3046 MW 84 F 17 3102 MW 77 F 18 2888 MW 78 F 19 2021 3317 MW 82 F 22 2867 MW 73 F 23 3055 MW 77 F 24 2991 MW 73 F 25 3006 MW 75 F 26 2728 2935 MW 78 F 29 3165 MW 82 F 30 3398 MW 86 F 31 3176 MW 78 F Average = 2916 MWTop days = 3383 MW (16 % more than avg)
")
22
Strong year to year variability

23
Peak day electrical load savings If knew electrical loads in advance: 16% With event constraints: 14% (Load is relative to an average summer afternoon)
")
24
July SundayMondayTuesdayWednesdayThursdayFridaySaturday 1 2990 MW 79 F 2 3031 MW 81 F 3 3389 MW 88 F 4 2958 MW 85 F 5 67 2814 MW 71 F 8 2766 MW 73 F 9 2791 MW 75 F 10 2906 MW 79 F 11 3106 MW 83 F 12 1314 3130 MW 76 F 15 3089 MW 74 F 16 3046 MW 84 F 17 3102 MW 77 F 18 2888 MW 78 F 19 2021 3317 MW 82 F 22 2867 MW 73 F 23 3055 MW 77 F 24 2991 MW 73 F 25 3006 MW 75 F 26 2728 2935 MW 78 F 29 3165 MW 82 F 30 3398 MW 86 F 31 3176 MW 78 F Average = 2916 MW

25
July SundayMondayTuesdayWednesdayThursdayFridaySaturday 1 2990 MW 79 F 2 3031 MW 81 F 3 3389 MW 88 F 4 2958 MW 85 F 5 67 2814 MW 71 F 8 2766 MW 73 F 9 2791 MW 75 F 10 2906 MW 79 F 11 3106 MW 83 F 12 1314 3130 MW 76 F 15 3089 MW 74 F 16 3046 MW 84 F 17 3102 MW 77 F 18 2888 MW 78 F 19 2021 3317 MW 82 F 22 2867 MW 73 F 23 3055 MW 77 F 24 2991 MW 73 F 25 3006 MW 75 F 26 2728 2935 MW 78 F 29 3165 MW 82 F 30 3398 MW 86 F 31 3176 MW 78 F Average = 2916 MWWarm days = 3237 MW (11 % more than avg)
")
26
Peak day electrical load savings If knew electrical loads in advance: 16% With event constraints: 14% If knew temperature in advance: 11% (Load is relative to an average summer afternoon)
")
27
What can climate analysis say?

28
Peak day electrical load savings If knew electrical loads in advance: 16% With event constraints: 14% If knew temperature in advance: 11% Super simple scheme (24C, 0.5): 6% (Load is relative to an average summer afternoon)
: 6% (Load is relative to an average summer afternoon)")
29
Optimizing the process

30
Peak day summary Might ultimately be a real-time program –Driven by "smart" electric meters –Main benefit would be avoided cost of peaker generation plants ~$12M/yr. Until then, climate prediction: –Far less deployment cost –Cost of avoided procurement ~$1.3M/yr -> Climate analysis can give expected benefits to a program

31
3. Irrigation pump loads Electricity use in Pacific Northwest strongly driven by irrigation pumps When will the pumps start? What will total seasonal use be?

32
Irrigation pump start date Idaho Falls, ID

33
Pump start date

34
Total use over summer Idaho Falls, ID

35
Total load affected by soil moisture

36
Predicting summer temperature based on spring temperature

37
Irrigation load summary Buying power contracts 2 months ahead of a high-load summer saves $25/MWh (over spot market price) Use: about 100,000 MWh Benefit of 2 month lead time summer load forecast: $2.5 M
 Use: about 100,000 MWh Benefit of 2 month lead time summer load forecast: $2.5 M")
38
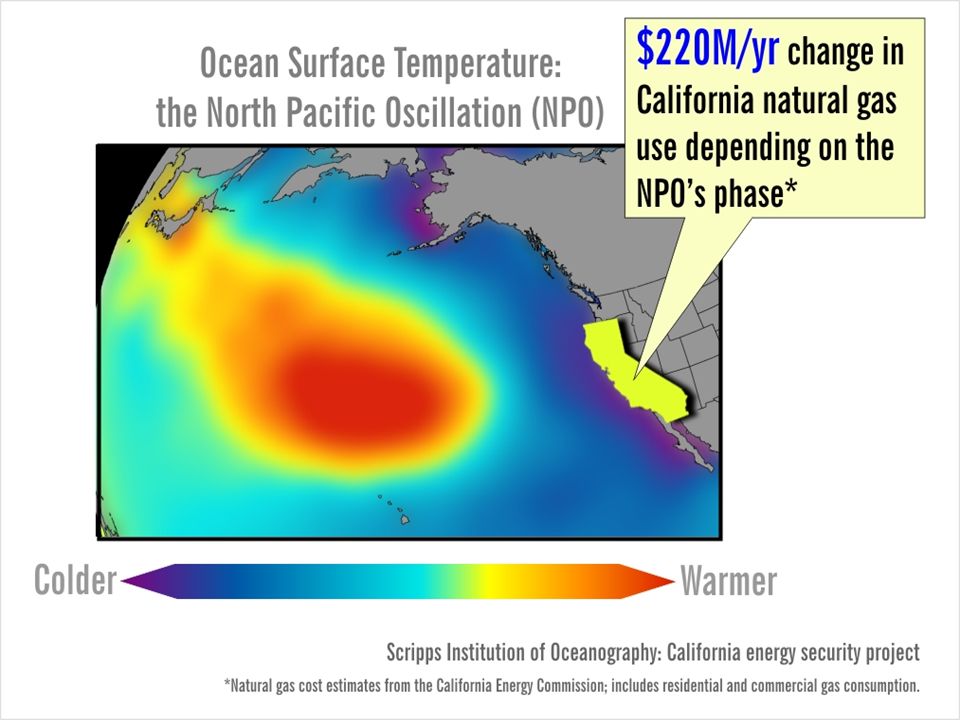
4. Pacific Sea Surface Temperatures

39
Why the NPO matters Higher than usual pressure associated with the NPO… generates anomalous winds from the north west… …which bring more cold, arctic air into the western U.S. during winter

40
NPO and heating degree days Positive NPO Negative NPO Difference is about 150 HDD, or 5% of total HDD

42
Summer forecast objectives Develop forecasts of interest to the CEC Focus on: extreme events, strings of hot days, CDD Technique: use an advanced statistical approach (Canonical Correlation Analysis)
")
43
Extreme events Same temperature threshold (e.g. 95 °F) => Same percentile threshold (e.g. 95th) =>
 => Same percentile threshold (e.g. 95th) =>")
44
Spring SST predicting summer temperatures CDD Tmax-95 th percentile

45
Relationship PDO => California Summertime Temperatures Correlations, Mode 1- Tmean, JJA => Correlations, Mode 1-PSST, MAM

46
Contingency Analysis (conditional probabilities): = 0.01 => ***, 0.05 => **, 0.10 => *
: = 0.01 => ***, 0.05 => **, 0.10 => *")
47
Summer CDD when PDO above normal in spring

48
Pacific SST & CA temperatures summary Spring Pacific sea surface temperatures predict summer temperature in California Above normal PDO is associated with warm CA summers (and below normal PDO with cold summers) Possible uses of this information include risk reduction, and improved planning and reliability
 Possible uses of this information include risk reduction, and improved planning and reliability")
49
5. Precipitation, Runoff, and Hydropower Work done by U.W. hydrology group (Dennis Lettenmaier, Alan Hamlet, Nathalie Voisin) How much does hydropower production vary given realistic climate fluctuations? What are the regional implications?
 How much does hydropower production vary given realistic climate fluctuations. What are the regional implications .")
50
Step 1: Develop climate forcing fields Raw station data is biased because stations mostly at low altitude, but streamflow influenced by high-altitude precipitation Can correct for altitude effects Period: 1916-2002

51
Step 1: Develop climate forcing fields

52
Step 2: Apply to soil/streamflow model Nathalie Voisin et al., Univ. Washington, 2004

54
Step 3. Verify streamflow Nathalie Voisin et al., Univ. Washington, 2004

55
Step 4. Apply to reservoir model ColSim (Columbia Simulation) for the Pacific Northwest CVmod (Central Valley model) for Sacramento-San Joaquin basin Use realistic operating rules: –Energy content curves (ECC) for allocating hydropower –US Army Corp of Engineers rule curves for flood prevention –Flow for fish habitat under Biological Opinion Operating Plan –Agricultural withdrawal estimated from observations –Recreational use of Grand Coulee Dam reservoir
 for the Pacific Northwest CVmod (Central Valley model) for Sacramento-San Joaquin basin Use realistic operating rules: –Energy content curves (ECC) for allocating hydropower –US Army Corp of Engineers rule curves for flood prevention –Flow for fish habitat under Biological Opinion Operating Plan –Agricultural withdrawal estimated from observations –Recreational use of Grand Coulee Dam reservoir.")
56
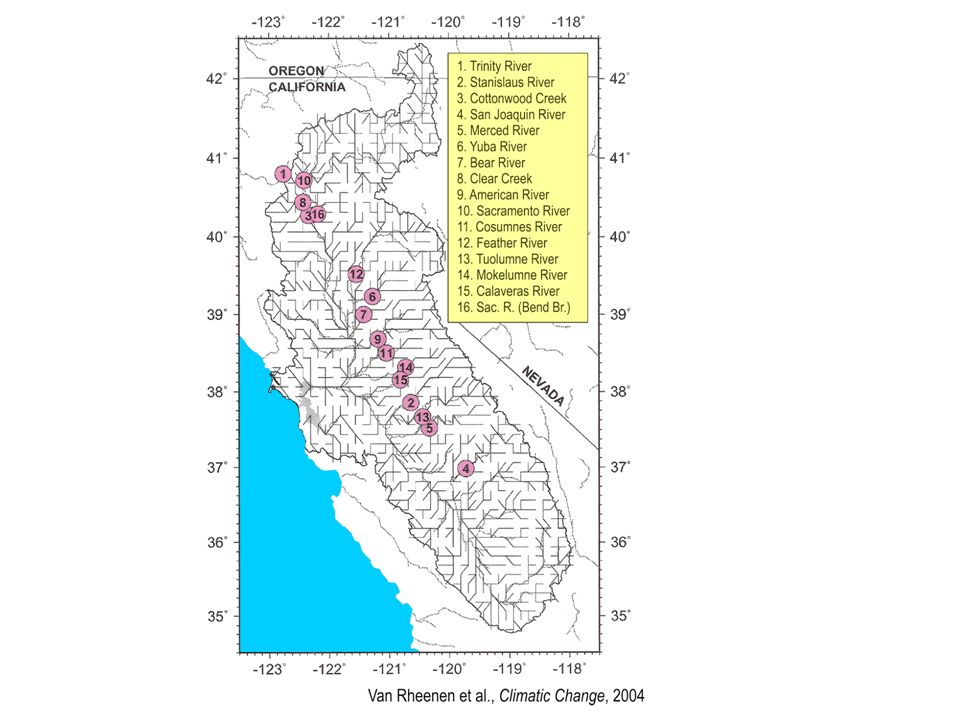
Major components of CVmod Lake Shasta Lake Trinity Whiskeytown Reservoir Lake Oroville Folsom Lake Pardee/Camanche Resv. New Hogan Reservoir New Melones Reservoir New Don Pedro Res./Lake McClure Millerton/Eastman/Hensley Sacramento-San Joaquin Delta San Luis Reservoir Flood control, navigation, fish conservation Water supply, hydropower, fish conservation Flood control, hydropower Flood control, water supply, hydropower, water quality, environmental conservation Flood control, water supply, hydropower Flood control, water supply Flood control, water supply, water quality, hydropower Flood control, water supply Water supply, recreation Water supply, water quality Water supply, hydropower USBR DWR USBR EBMUD COE USBR TMID, MC USBR, COE USBR, DWR USBR: Bureau of Reclamation DWR: CA Dept Water Resources EBMUD: East Bay Municipal District MC: Merced County TID: Turlock Irrigation District COE: US Army Corp of Engineers Van Rheenen et al., Climatic Change, 2004

57
Step 5. Hydropower production N. Voisin et al., Univ. Wash., 2004

58
Hydropower summary Strong climate-related year to year variability in CA hydropower Working on forecasting that variability using same techniques that worked for summer temperatures Possible benefits of such forecasts include better water/hydropower management and reduced costs

59
Case studies: summary What is the economic value of climate forecasts to the energy sector? 1.Improved bay area and delta breeze forecasts: $100K’s to low $millions/yr 2.Peak day load management: ~$1-10M/yr 3.Pump loads: ~$2M/yr 4.Pacific SSTs: benefits of the information might include risk reduction, improved reliability, and improved planning 5.Hydropower: better water management, reduced costs

60
Where we could go from here…

61
Climate variations… El Nino North Pacific Oscillation (NPO)
")
62
…affect energy… supply demand

63
…and therefore decisions. Environment vs. HydropowerUrban vs. Agriculture Long term contracts vs. Spot market

64
Water-Energy interaction Climate Forecast Water Supply Forecast Energy Supply & Demand Forecast Public and Private Stakeholders

65
An Energy-Water Opportunity

66
Water and power are regional issues -- need a broad, integrated look at the issue

67
An Energy-Water Opportunity Water and power are regional issues -- need a broad, integrated look at the issue Water and energy systems already stressed to their limits -- climate variations can push things over the edge

68
An Energy-Water Opportunity Water and power are regional issues -- need a broad, integrated look at the issue Water and energy systems already stressed to their limits -- climate variations can push things over the edge The pieces to do this problem are already there -- but no one has brought them all together yet

69
An Energy-Water Opportunity Water and power are regional issues -- need a broad, integrated look at the issue Water and energy systems already stressed to their limits -- climate variations can push things over the edge The pieces to do this problem are already there -- but no one has brought them all together yet A project whose time has come

71
http://iri.columbia.edu/climate/forecast/net_asmt/2004/ind ex.html

72
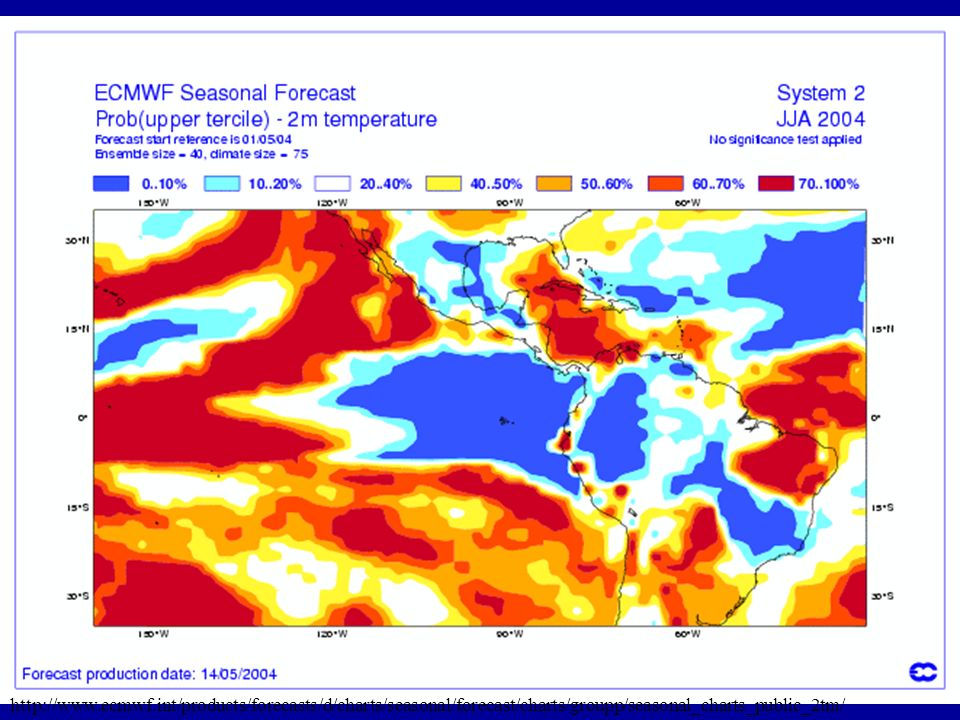
http://www.ecmwf.int/products/forecasts/d/charts/seasonal/forecast/charts/groupp/seasonal_charts_public_2tm/
73
Skill, CCA models

74
Climate & weather affect energy demand Source: www.caiso.com/docs/0900ea6080/22/c9/09003a608022c993.pdf On a warm summer afternoon, 40% of all electricity in California goes to air conditioning

75
…and also supply Green et al., COAPS Report 97-1 Typical effects of El Nino California imports 5-10% of its electricity from Pacific Northwest hydropower -- a dry winter over Washington can trigger higher summer electricity prices in California

Similar presentations


 the water year for which the December to February Sea Surface Temperature in the NINO 3.4.>")


