Download presentation
Presentation is loading. Please wait.

1
Graphs of Other Trigonometric Functions
Warm Up Lesson Presentation Lesson Quiz Holt McDougal Algebra 2 Holt Algebra 2

2
Warm Up If sin A = , evaluate. 1. cos A tan A 3. cot A sec A 5. csc A

3
Objective Recognize and graph trigonometric functions.

4
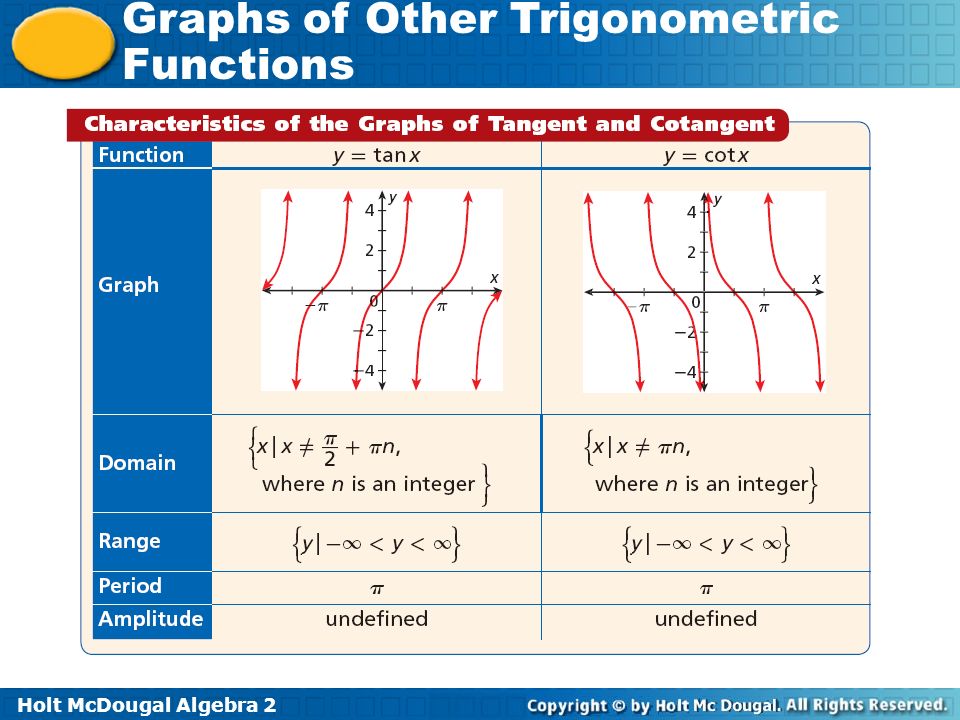
The tangent and cotangent functions can be graphed on the coordinate plane. The tangent function is undefined when θ = + n, where n is an integer. The cotangent function is undefined when θ = n. These values are excluded from the domain and are represented by vertical asymptotes on the graph. Because tangent and cotangent have no maximum or minimum values, amplitude is undefined. To graph tangent and cotangent, let the variable x represent the angle θ in standard position.

6
Like sine and cosine, you can transform the tangent function.

7
Example 1: Transforming Tangent Functions
Using f(x) = tan x as a guide, graph Identify the period, x-intercepts, and asymptotes. g(x) = Step 1 Identify the period. Because b = the period is Step 2 Identify the x-intercepts. The first x-intercept occurs at x = 0. Because the period is 3, the x-intercepts occurs at 3n where n is an integer.
 = tan x as a guide, graph. Identify the period, x-intercepts, and asymptotes. g(x) = Step 1 Identify the period. Because b = the period is. Step 2 Identify the x-intercepts. The first x-intercept occurs at x = 0. Because the period is 3, the x-intercepts occurs at 3n where n is an integer.")
8
Example 1 Continued Step 3 Identify the asymptotes. Because b = , the asymptotes occur at Step 4 Graph using all of the information about the function.

9
Check It Out! Example 1 Using f(x) = tan x as a guide, graph Identify the period, x-intercepts, and asymptotes. Step 1 Identify the period. Because b = the period is Step 2 Identify the x-intercepts. The first x-intercept occurs at x = 0. Because the period is 2, the x-intercepts occur at 2n where n is an integer.

10
Check It Out! Example 1 Continued
Step 3 Identify the asymptotes. Step 4 Graph using all of the information about the function.

12
Example 2: Graphing the Cotangent Function
Using f(x) = cot x as a guide, graph Identify the period, x-intercepts, and asymptotes. Step 1 Identify the period. Because b = 3 the period is Step 2 Identify the x-intercepts. The first x-intercept occurs at x = . Because the period is , the x-intercepts occurs at , where n is an integer.
 = cot x as a guide, graph . Identify the period, x-intercepts, and asymptotes. Step 1 Identify the period. Because b = 3 the period is. Step 2 Identify the x-intercepts. The first x-intercept occurs at x = . Because the period is , the x-intercepts occurs at. , where n is an integer.")
13
Example 2: Graphing the Cotangent Function
Step 3 Identify the asymptotes. Because b = 3, the asymptotes occur at Step 4 Graph using all of the information about the function.

14
Check It Out! Example 2 Using f(x) = cot x as a guide, graph g(x) = –cot2x. Identify the period, x-intercepts, and asymptotes. Step 1 Identify the period. Because b = 2 the period is Step 2 Identify the x-intercepts. The first x-intercept occurs at x = . Because the period is , the x-intercepts occurs at , where n is an integer.

15
Check It Out! Example 2 Continued
Step 3 Identify the asymptotes. Because b = 2, the asymptotes occur at x = Step 4 Graph using all of the information about the function.

16
Recall that sec θ = So, secant is undefined where cosine equals zero and the graph will have vertical asymptotes at those locations. Secant will also have the same period as cosine. Sine and cosecant have a similar relationship. Because secant and cosecant have no absolute maxima, no minima, amplitude is undefined.

18
You can graph transformations of secant and cosecant by using what you learned in Lesson 14-1 about transformations of graphs of cosine and sine.

19
Example 3: Graphing Secant and Cosecant Functions
Using f(x) = cos x = as a guide, graph g(x) = Identify the period and asymptotes. Step 1 Identify the period. Because sec is the reciprocal of cos the graphs will have the same period. Because b = for cos the period is
 = cos x = as a guide, graph. g(x) = Identify the period and. asymptotes. Step 1 Identify the period. Because sec is the reciprocal of. cos the graphs will have the same period. Because b = for cos the period is.")
20
Example 3 Continued Step 2 Identify the asymptotes. Because the period is 4, the asymptotes occur at where n is an integer. Step 3 Graph using all of the information about the function.

21
Check It Out! Example 3 Using f(x) = sin x as a guide, graph g(x) = 2csc x. Identify the period and asymptotes. Step 1 Identify the period. Because csc x is the reciprocal of sin x the graphs will have the same period. Because b = 1 for csc x the period is

22
Check It Out! Example 3 Continued
Step 2 Identify the asymptotes. Because the period is 2, the asymptotes occur at Step 3 Graph using all of the information about the function.

23
Lesson Quiz: Part I 1. Using f(x) = tan x as a guide, graph g(x) = Identify the period, x-intercepts, and asymptotes. period: 2; x-intercepts: 2n; asymptotes: x = + 2n

24
Lesson Quiz: Part II 2. Using f(x) = sin(x) as a guide, graph g(x) = Identify the period, and asymptotes. period: 6; asymptotes: x = 3n

Similar presentations


>")


