Download presentation
Presentation is loading. Please wait.

2
Catalyst 1.Define endothermic. Give an example. 2.Define exothermic. Give an example 3.I cool a glass of water, is this an endothermic process or an exothermic process? End

4
Lecture 7.2 – Heating Curves and Phase Diagrams

5
Today’s Learning Targets 7.3 – I can draw a phase diagram to describe how pressure and temperature are related and discuss what a triple point is. 7.4 – I can analyze and draw a heating curve to describe how energy is lost or gained while a substance changes phases. I can identify on the graph the H fusion and the H vaporization. 7.5 – I can describe a reaction using the ideas of enthalpy and entropy.

6
Today’s Focus Question How much energy is required to turn my Flamin’ Hot Cheetos into a liquid?

7
What are enthalpy and entropy?

8
I. Enthalpy (ΔH) Enthalpy is a measure of the total energy that a system has. Amount of energy released or absorbed during a process/reaction. Measured in kilojoules (kJ)
.")
9
II. Entropy (ΔS) The universe tends towards disorder. Entropy is the measurement of the randomness or disorder of a system. More energy = more disorder Measure in J/K

11
How are enthalpy and phase changes related?

12
I. ΔH fusion and ΔH vaporization Large amount of energy that is required to change phases ΔH fusion = Energy to change solid to a liquid. ΔH vaporization = Energy to change liquid to a gas. ΔH freezing = Energy to change liquid to a solid ΔH condensation = Energy to change gas to a liquid

13
II. Heating Curves Heating curves are graphs of the relationship between temperature and time. Allow us to identify important values

14
ΔH of vaporization/condensat ion ΔH of fusion/freezing

15
Summarize

17
Justify – TPS Why was the water able to boil at room temperature when we dropped the pressure?

18
How are pressure temperature and phase related?

19
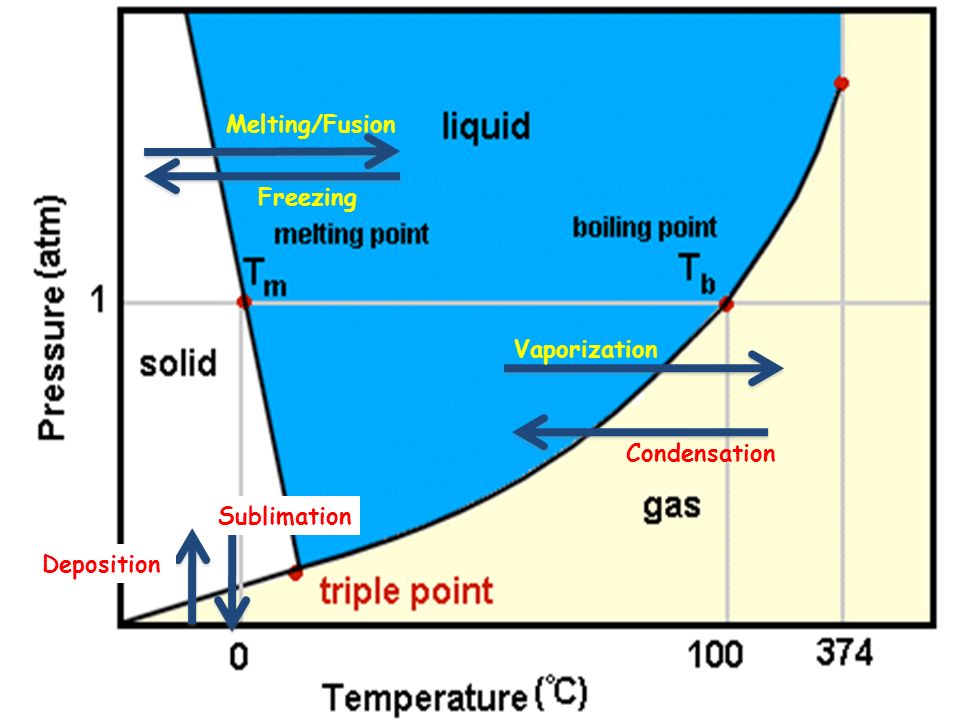
I. Pressure and Temperature The state of matter of a substance depends on both the temperature and pressure A phase diagram is a graph temperature, pressure, and phase for a substance

21
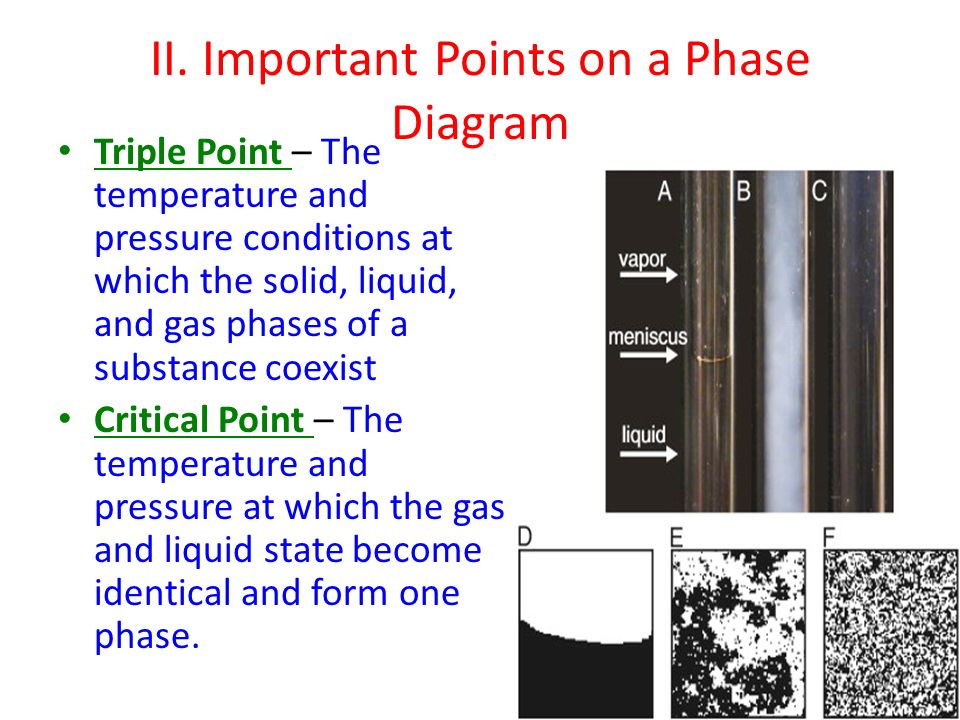
II. Important Points on a Phase Diagram Triple Point – The temperature and pressure conditions at which the solid, liquid, and gas phases of a substance coexist Critical Point – The temperature and pressure at which the gas and liquid state become identical and form one phase.

23
Vaporization Condensation Melting/Fusion Freezing Sublimation Deposition

24
Class Example You have a solid at a pressure of 30 atm and -15 o C, if you decrease the pressure at constant temperature, what phases will the substance go through?

25
Table Talk

26
Stop and Jot Atmospheric pressure on Mt. Everest is 0.29 atm. What is the boiling point of water there using the phase diagram below.

27
Summarize

28
Vocab Direct Instruction Assignment With our group, let’s do some vocab definitions! Make a power point defining each of these terms: Enthalpy Entropy Δh fusion Δh vaporization ΔH freezing Make a powerpoint slide for each vocab word with a picture, title, and a definition! Δh condensation Heating curves phase diagram Critical Point Triple Point

29
Collaborative - Let’s Heat Some Water! With the table complete the heating curve lab activity. Heat the ice until it reaches a rolling boil Show Mr. Astor when you are done

30
Independent Work Time Complete the phase diagram homework you picked up when you came in.

31
Learning Log Assessment Rate yourself 1 – 4 on LTs 7.3, 7.4, and 7.5

32
Exit Slip 1.What is entropy? 2.Draw a basic heating curve. Have temperature on the y-axis and heat added on the x-axis. Label solid, liquid, gas, boiling, and freezing. 3.What is the triple point on the graph below?

33
Learning Log Assessment Rate yourself 1 – 4 on LTs 7.3, 7.4, and 7.5

35
Closing Time Homework 7.2 due Monday/Tuesday Rough Draft Due Monday/Tuesday Quiz on Cheetos lab Monday/Tuesday

Similar presentations


 Kinetic Energy - energy of motion, associated with heat.>")


