Download presentation
Presentation is loading. Please wait.

1
Epidemiology of Drinking Waterborne and Foodborne Disease
ENVR 421 Mark D. Sobsey

2
Pyramid of Water- and Food-borne Disease

3
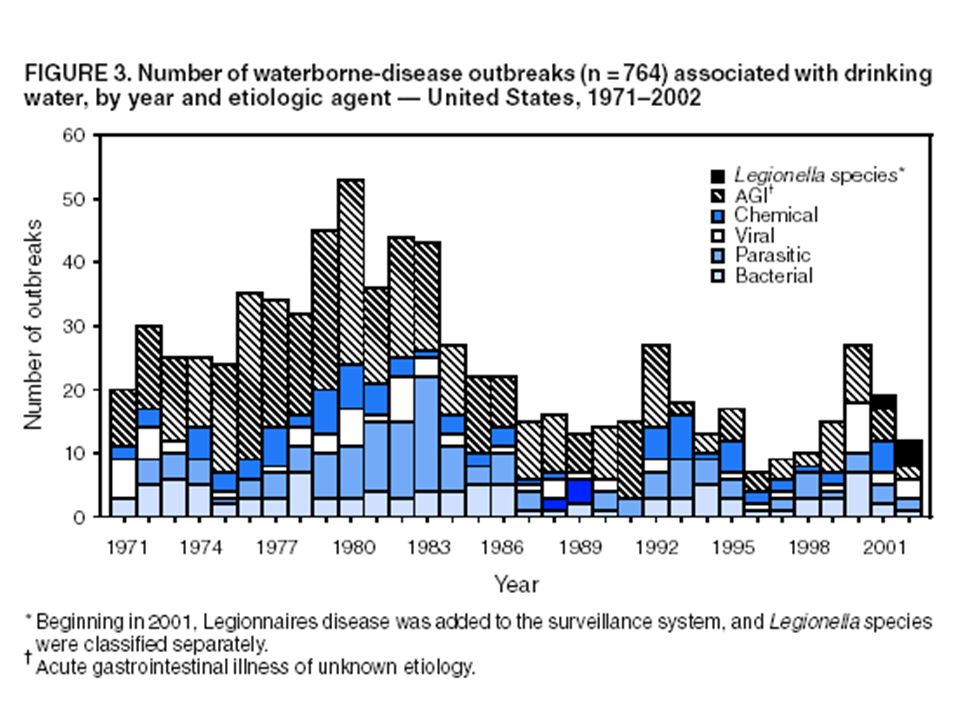
Drinking Water‑borne Disease Outbreaks in the U.S.
Information comes from reported waterborne outbreaks Based on two or more cases from a drinking water Data compiled by a passive reporting system to the Centers for Disease Control (CDC), and the Environmental Protection Agency (EPA) for water Many outbreaks are not noticed or reported Reported outbreaks are the "tip of the iceberg” Estimated unreported/unrecognized outbreaks: 50-90% Etiological agent is not identified or recognized in many outbreaks The fraction of outbreaks for which an etiological agent is identified had increased in recent years Etiologic agent is rarely isolated from the incriminated water Etiologic agent is usually isolated and identified from cases of ill persons
, and the Environmental Protection Agency (EPA) for water. Many outbreaks are not noticed or reported. Reported outbreaks are the tip of the iceberg Estimated unreported/unrecognized outbreaks: 50-90% Etiological agent is not identified or recognized in many outbreaks. The fraction of outbreaks for which an etiological agent is identified had increased in recent years. Etiologic agent is rarely isolated from the incriminated water. Etiologic agent is usually isolated and identified from cases of ill persons.")
4
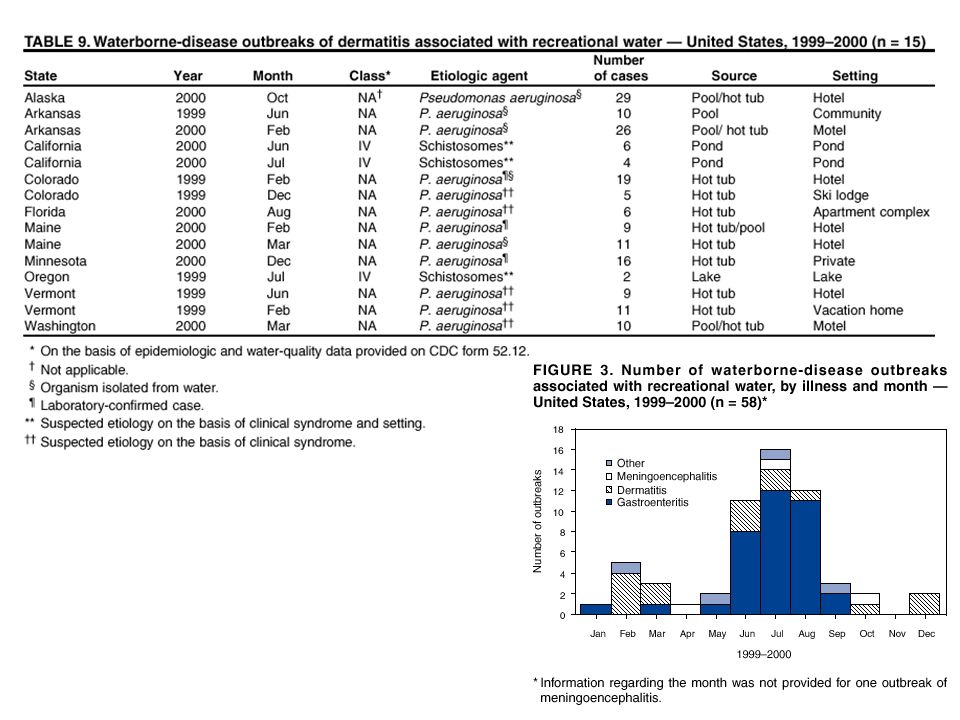
Waterborne Outbreaks in the United States, 1989-1994
Etiologic Agent No. Outbreaks No. Cases Acute GI (unknown) ,264 Cryptosporidium parvum ,822 Giardia lamblia ,205 Hepatitis A virus Norwalk-like viruses E. coli O157:H Cyclospora cayatenensis 1 21 Shigella spp Salmonella sp Vibrio cholerae (non-01) 1 11 Chemicals: Pb, NO3, F and Cu TOTAL ,256
 44 16,264. Cryptosporidium parvum 8 406,822. Giardia lamblia 16 1,205. Hepatitis A virus Norwalk-like viruses E. coli O157:H Cyclospora cayatenensis Shigella spp Salmonella sp Vibrio cholerae (non-01) Chemicals: Pb, NO3, F and Cu TOTAL ,256.")
14
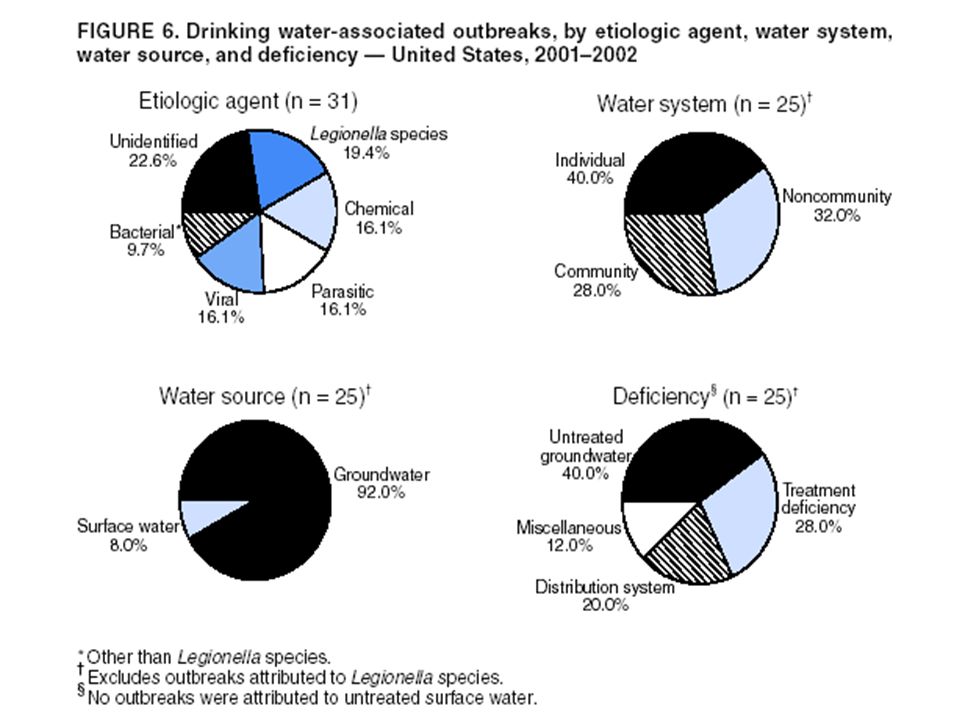
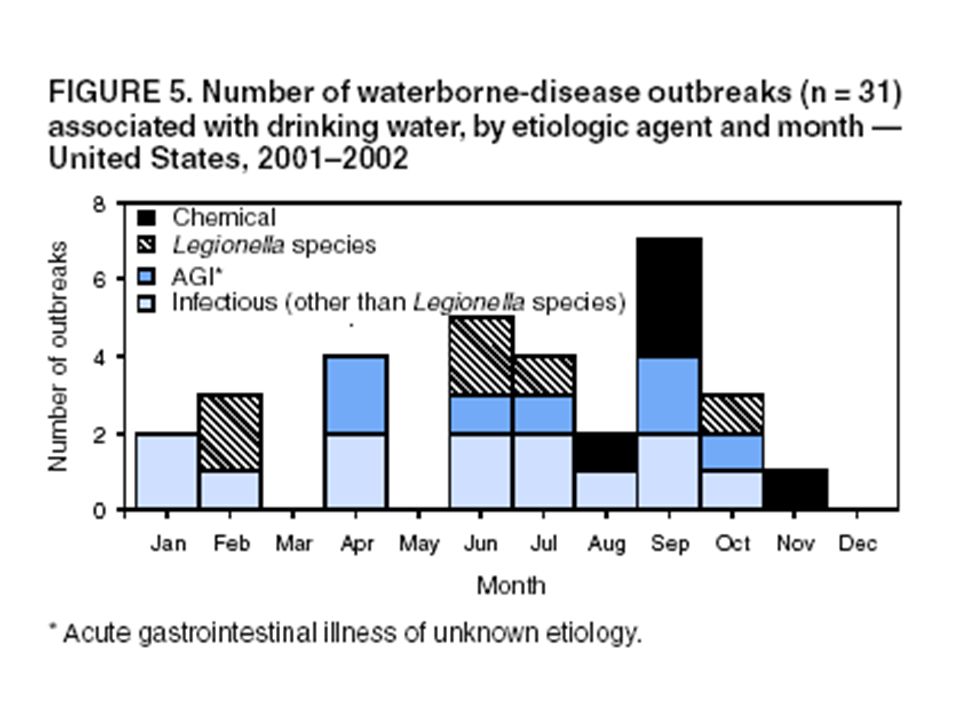
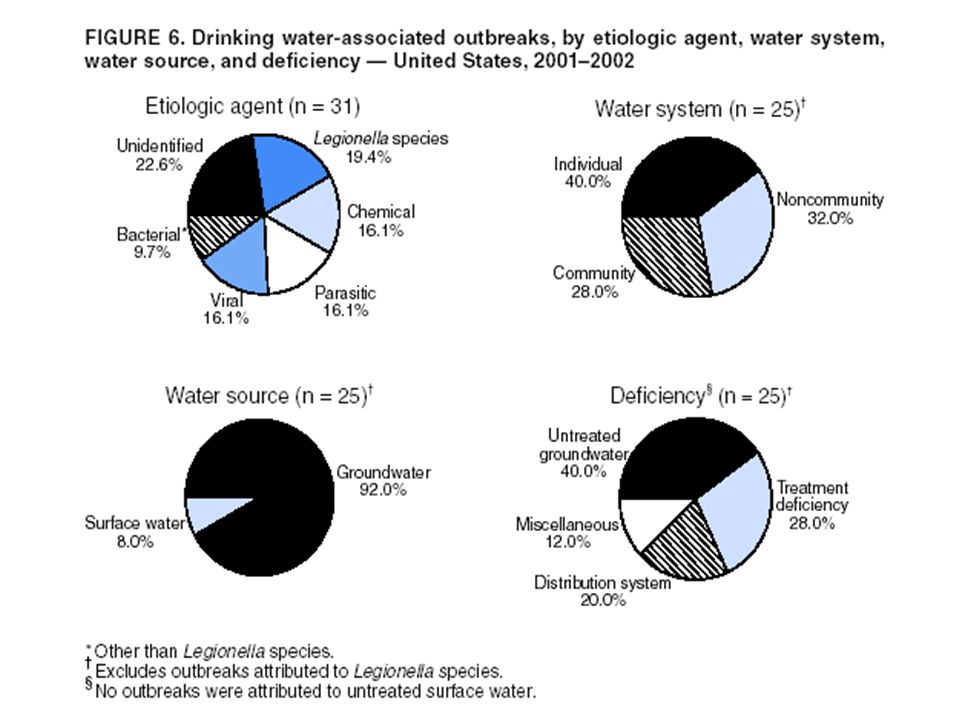
WB Disease Outbreaks 31 drinking water OBs reported by 19 states. 1,020 ill persons and seven deaths. Microbe or chemical causing OB was identified for 24 (77.4%) of the 31 outbreaks. Of the 24 identified outbreaks,: 19 (79.2%) were associated with pathogens 5 (20.8%) associated with acute chemical poisonings.
 of the 31 outbreaks. Of the 24 identified outbreaks,: 19 (79.2%) were associated with pathogens. 5 (20.8%) associated with acute chemical poisonings.")
15
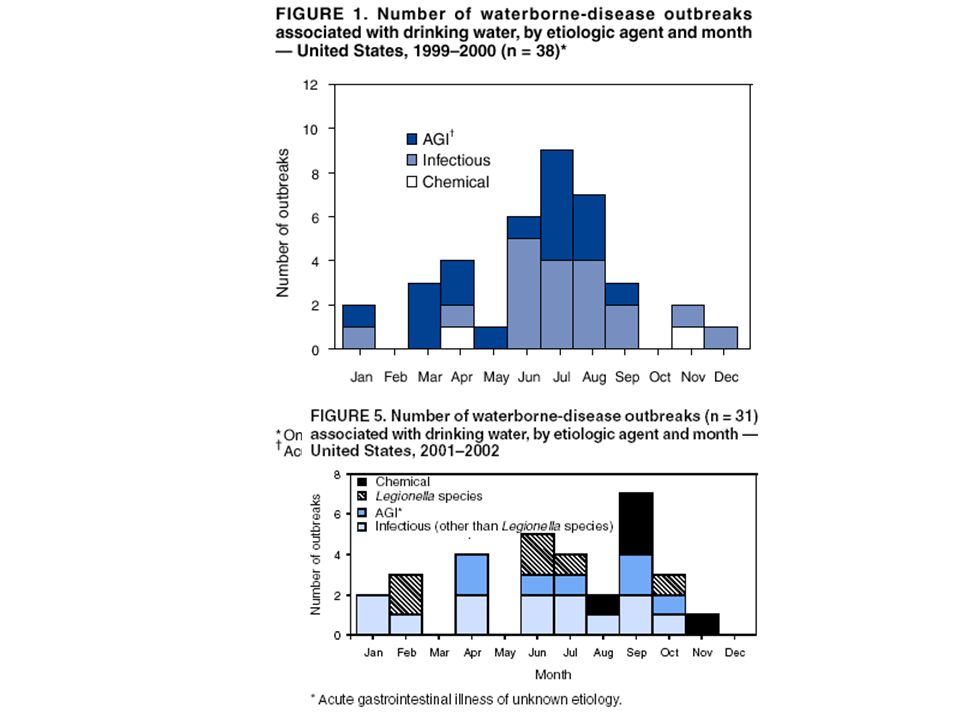
WB Disease Outbreaks 2001-2002 5 OBs caused by norovirus
5 OBs by parasites 3 OBs by non-Legionella bacteria 6 OBs of Legionnaires disease (LD) 7 OBs of acute GI illness of unknown etiology suspected of having an infectious cause. Of the 25 non-Legionella Obs: 23 (92.0%) in systems using groundwater sources 9 (39.1%) of these 23 GW ObB were associated with private noncommunity wells not regulated by EPA
 7 OBs of acute GI illness of unknown etiology suspected of having an infectious cause. Of the 25 non-Legionella Obs: 23 (92.0%) in systems using groundwater sources. 9 (39.1%) of these 23 GW ObB were associated with private noncommunity wells not regulated by EPA.")
16
Preventing Drinking Waterborne Outbreaks
For surface water supplies, most outbreaks could be eliminated if treatment consisted of proper filtration (including pre‑treatment by coagulation-flocculation) and disinfection. For groundwater supplies, most outbreaks could be eliminated if proper disinfection was used.
 and disinfection. For groundwater supplies, most outbreaks could be eliminated if proper disinfection was used.")
17
Actual Risk of Enteric Illness in a Drinking Water Supply from a Surface Source: Epidemiological Studies Payment et al., 1991, 1997 Laval (Montreal suburb), Quebec, Canada Drinking water from a sewage-contaminated river source Water is extensively treated to make drinking water Compared GI illness rates in two sets (~300 each) of households (four sets in 2nd study): One set used ordinary tap water Other set used reverse osmosis filtered water (no pathogens) 2nd study: also distribution system-tapwater 2nd study: also treated water bottled at water treatment plant GI illness rates were about 25-35% (~15% in 2nd study) higher in tap water households Dose-response relationship: increased illness with increased tap water consumption (glasses/day) No pathogens were detected in the water Water met all standards for quality, including coliforms and turbidity.
, Quebec, Canada. Drinking water from a sewage-contaminated river source. Water is extensively treated to make drinking water. Compared GI illness rates in two sets (~300 each) of households (four sets in 2nd study): One set used ordinary tap water. Other set used reverse osmosis filtered water (no pathogens) 2nd study: also distribution system-tapwater. 2nd study: also treated water bottled at water treatment plant. GI illness rates were about 25-35% (~15% in 2nd study) higher in tap water households. Dose-response relationship: increased illness with increased tap water consumption (glasses/day) No pathogens were detected in the water. Water met all standards for quality, including coliforms and turbidity.")
18
“Payment Studies”: References
Payment P., et al, (1991). A Randomized Trial to Evaluate the Risk of Gastrointestinal Disease due to Consumption of Drinking Water Meeting Current Microbiological Standards. American Journal of Public Health 81 (6) Payment P., et al (1997). A prospective epidemiological study of gastrointestinal health effects due to the consumption of drinking water. International Journal of Environmental Health Research. 7(1)
. A Randomized Trial to Evaluate the Risk of Gastrointestinal Disease due to Consumption of Drinking Water Meeting Current Microbiological Standards. American Journal of Public Health 81 (6) Payment P., et al (1997). A prospective epidemiological study of gastrointestinal health effects due to the consumption of drinking water. International Journal of Environmental Health Research. 7(1)")
19
Risks of Gastrointestinal Illness from Tapwater vs. RO-filtered Water
“Payment Study”, 1991: Risks of Gastrointestinal Illness from Tapwater vs. RO-filtered Water

20
Risks of Gastrointestinal Illness from Tapwater vs. RO-filtered Water
“Payment Study”, 1991: Risks of Gastrointestinal Illness from Tapwater vs. RO-filtered Water

33
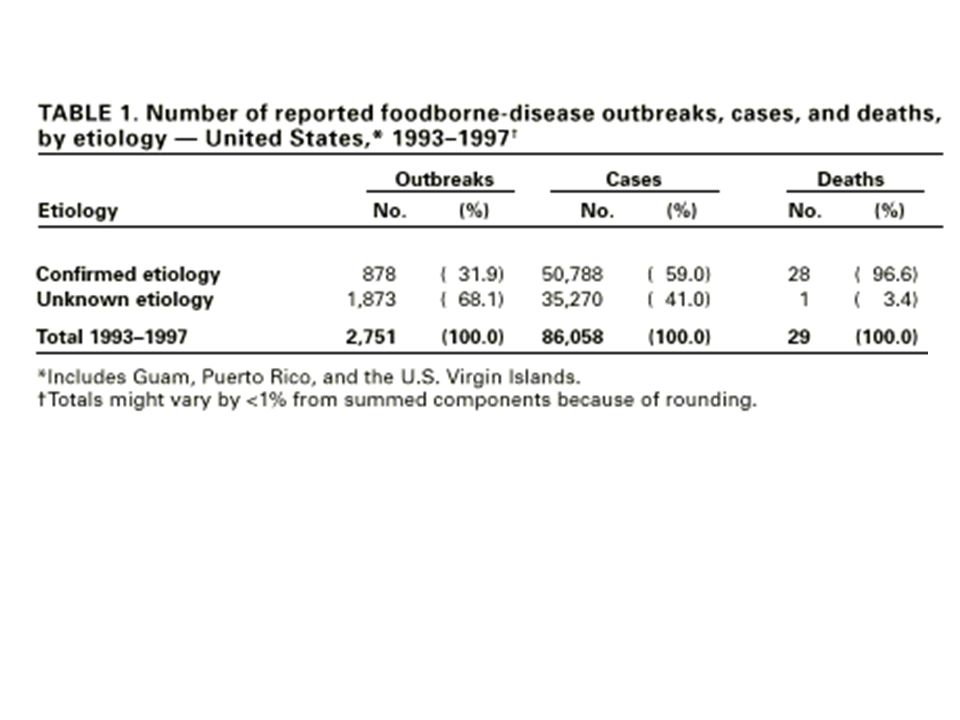
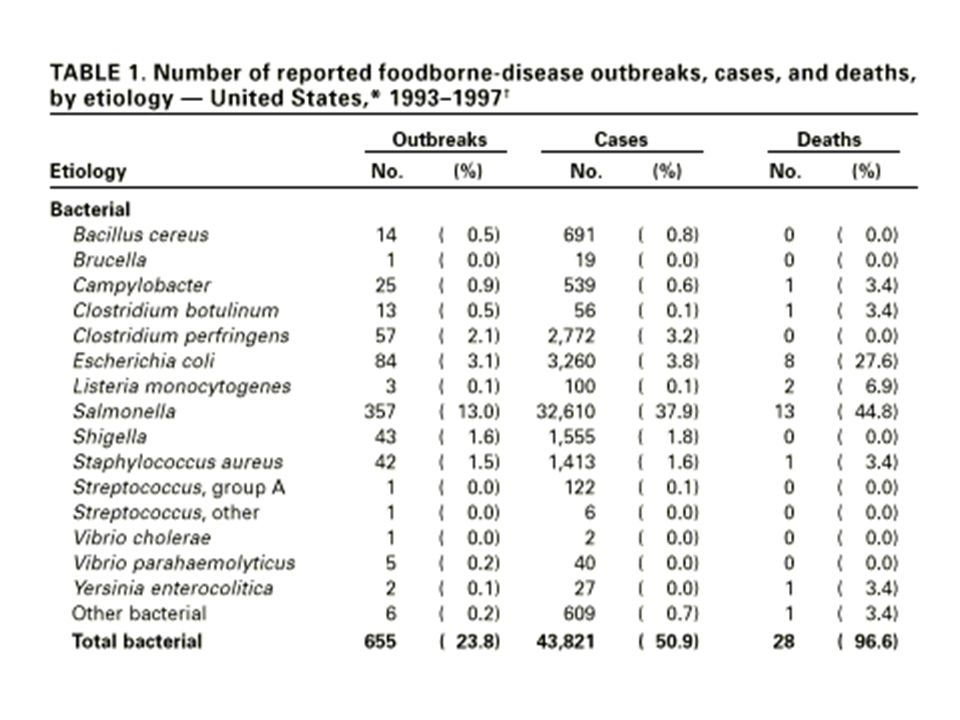
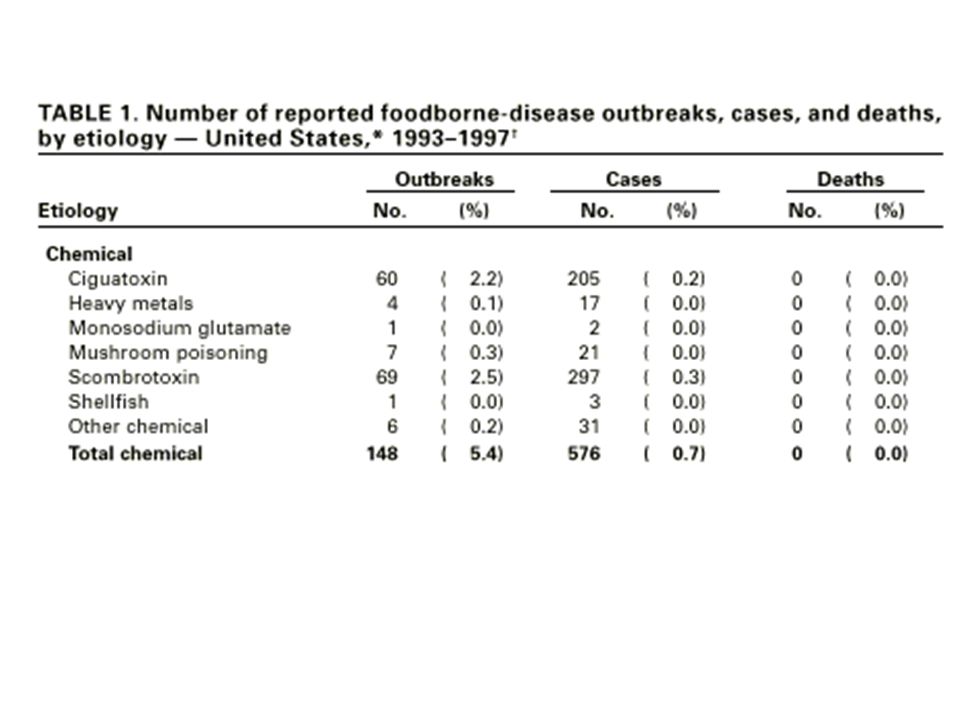
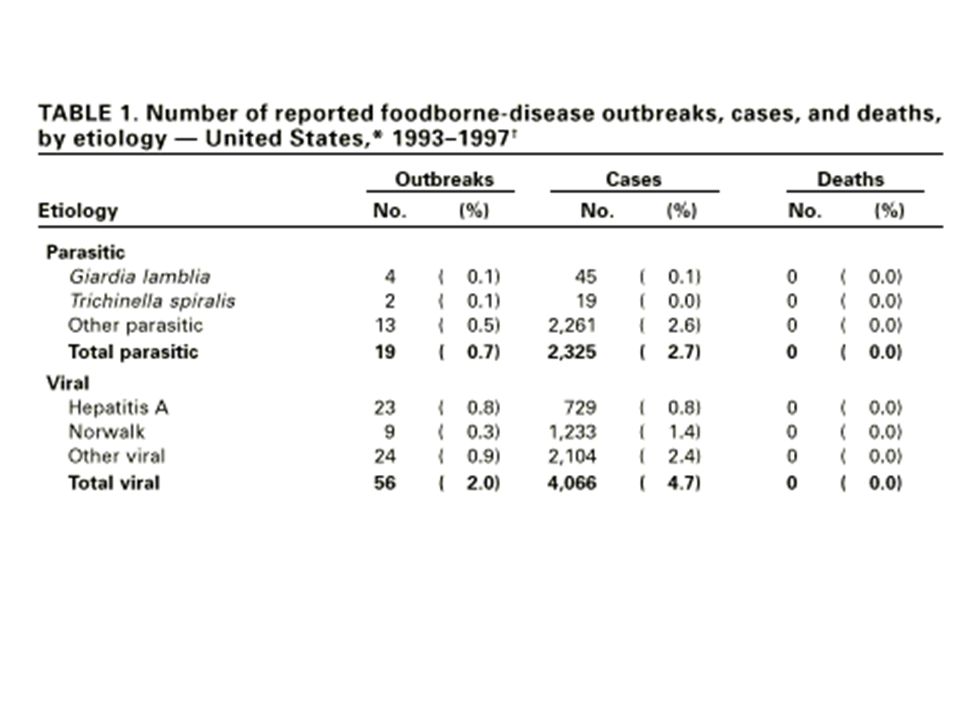
Foodborne Disease in The USA: 1993-1997
Bacterial pathogens caused most outbreaks/infections with a known etiology But, 68% of reported FBDOs were of unknown etiology Need improved epidemiologic and lab investigations. ~ 50% had incubations period of >15 hours, suggesting viral etiology. Viruses (e.g., Norwalk-like viruses) are likey a much more important cause of foodborne disease outbreaks than is currently recognized. Local and state public health lack resources and expertise to diagnose viral pathogens, but the methods are now increasingly available in some state laboratories. Viral outbreaks are more likely to detected in the future.
 are likey a much more important cause of foodborne disease outbreaks than is currently recognized. Local and state public health lack resources and expertise to diagnose viral pathogens, but the methods are now increasingly available in some state laboratories. Viral outbreaks are more likely to detected in the future.")
34
Foodborne Disease in the Home
About half of all Salmonella cases result from unsafe handling of food in the home. Foodborne illness costs the United States $23 billion annually. Foodborne illness is often mistaken for “the flu, as many of the symptomsa are similar: stomach pain, diarrhea, nausea, chills, fever, and headache. Many experts believe the kitchen is home to more potentially dangerous bacteria than even the bathroom.

35
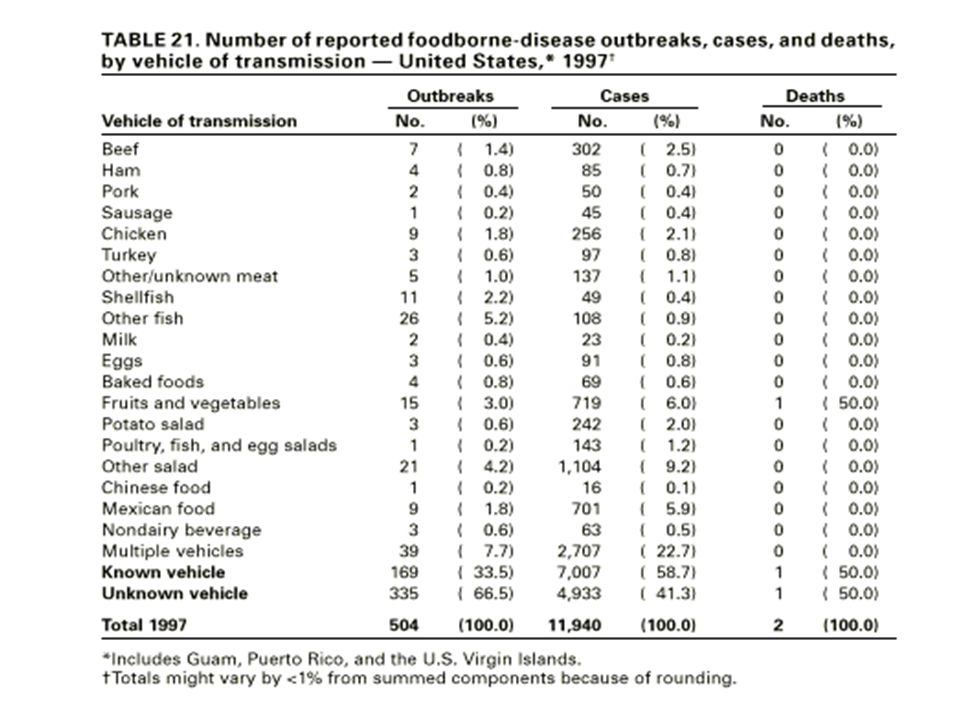
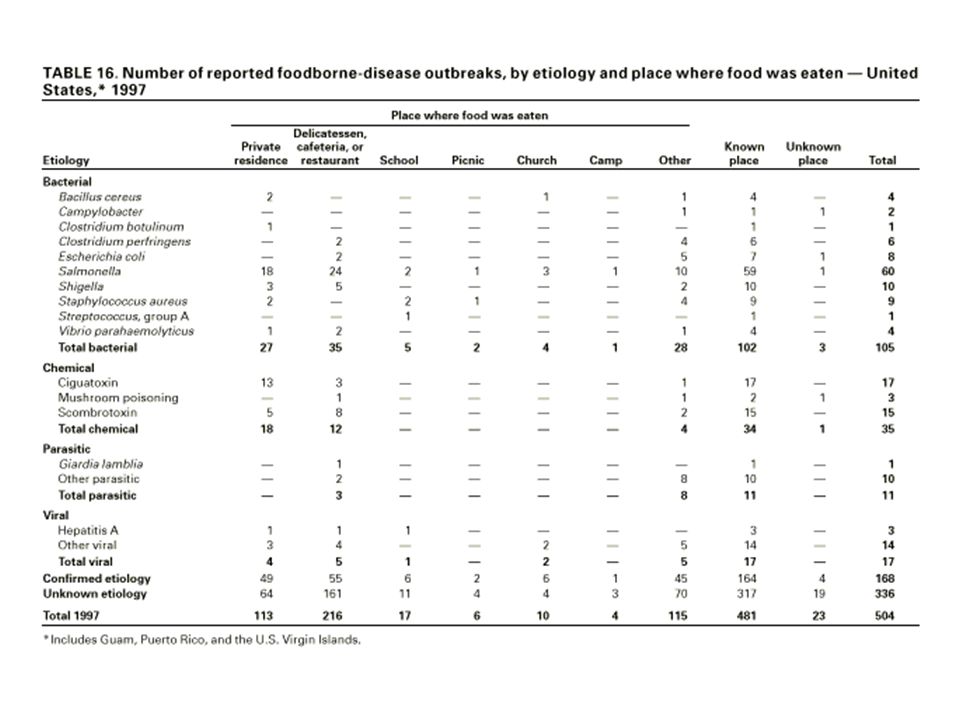
Foodborne Disease in The USA: 1993-1997
FBDOs with a known etiology: multistate outbreaks caused by contaminated produce and outbreaks caused by E. coli O157:H7 remained prominent. S. enteritidis remains a major cause of illness and death. ~40% of persons who died from S. enteritidis were residents of nursing homes. Seriousness of S. enteritidis in elderly persons, many of whom might be immunocompromised. Decrease risks for egg-associated infections of S. enteritidis by not eating raw or undercooked eggs. Nursing homes, hospitals, and commercial kitchens should use pasteurized egg products for all recipes requiring pooled or lightly cooked eggs. Proper egg storage in homes. Several outbreaks involved imported food items, emphasizes the role of food production and distribution in FBDOs.

36
Foodborne Disease Burden in the Unites States
Estimated 76 million illnesses and 5,000 deaths each year. Foodborne diseases are common, but only a fraction of these illnesses are routinely reported to CDC Passive surveillance system Many diseases not reportable a complex chain of events must occur to report a foodborne infection to CDC Most household foodborne infection are not recognized or reported

40
Salmonella Infection Causes an estimated 1.4 million foodborne illnesses/year From , only 189,304 Salmonella inections (~38,00/year) reported through the National Salmonella Surveillance System a passive, laboratory-based system. In the same period, 357 recognized outbreaks of Salmonella infection resulting in 32,610 illnesses were reported through the Foodborne-Disease Outbreak Surveillance System. These system greatly underestimate the burden of foodborne disease.
 reported through the National Salmonella Surveillance System. a passive, laboratory-based system. In the same period, 357 recognized outbreaks of Salmonella infection resulting in 32,610 illnesses were reported through the Foodborne-Disease Outbreak Surveillance System. These system greatly underestimate the burden of foodborne disease.")
44
Active Surveillance Network for Foodborne Disease in the United States: FoodNet
Foodborne disease component of the CDC's Emerging Infections Program (EIP). Established in 1995 Collaborative project among CDC, several EIP sites (states cities and territories), U.S. Department of Agriculture (USDA), and the U.S. Food and Drug Administration (FDA). Consists of active surveillance for foodborne diseases and related epidemiologic studies designed to help public health officials better understand the epidemiology of foodborne diseases in the United States.
. Established in Collaborative project among CDC, several EIP sites (states cities and territories), U.S. Department of Agriculture (USDA), and the U.S. Food and Drug Administration (FDA). Consists of active surveillance for foodborne diseases and. related epidemiologic studies designed to help public health officials better understand the epidemiology of foodborne diseases in the United States.")
45
FoodNet Surveillance Sites

46
FoodNet Program Tracks foodborne illness using:
Targeted Pathogens: Bacteria: Campylobacter E. coli O157 Listeria Salmonella Shigella Vibrio Yersinia Parasites: Cryptosporidium Cyclospora Tracks foodborne illness using: surveys of physicians and laboratories, case-control studies active case finding of targeted pathogens FoodNet Website:

47
Goals of FoodNet Describe the epidemiology of new and emerging bacterial, parasitic, and viral foodborne pathogens Estimate the frequency and severity of foodborne diseases that occur. Determine how much foodborne illness results from eating specific foods, such as meat, poultry, eggs produce, etc.

48
Components of FoodNet Active laboratory-based surveillance
Survey of clinical laboratories Survey of physicians Survey of the population Epidemiologic Studies

49
Water- and Foodborne Illness Surveillance in Other Countries
Efforts vary from country to country Most have little if any surveillance Some have more active and integrated surveillance than in the United States National health care systems Integrated laboratories Subsidized laboratory analyses Other incentives political, social, etc.

50
Laboratory Reports of Gastrointestinal Infections in England and Wales

51
Overview of Communicable Diseases England and Wales - Priorities

Similar presentations


 strives to reduce the serious negative.>")


 Rosen Public.>")


