Download presentation
Presentation is loading. Please wait.

1
LECTURE CENTRAL TENDENCIES & DISPERSION POSTGRADUATE METHODOLOGY COURSE

2
Measures of Central Tendency n Summarizes the entire data set into a single variable ( measurement ) n Measures of Central Tendency includes: –Mode –Median –Mean –Trimmed Mean –Skewness
 n Measures of Central Tendency includes: –Mode –Median –Mean –Trimmed Mean –Skewness")
3
Mode n The measurement that occurs most often ( with the highest frequency ) n Commonly used as a measure of popularity. n There can be more than 1 mode. n Not influence by extreme measurements. n Applicable for both qualitative and quantitative data.

4
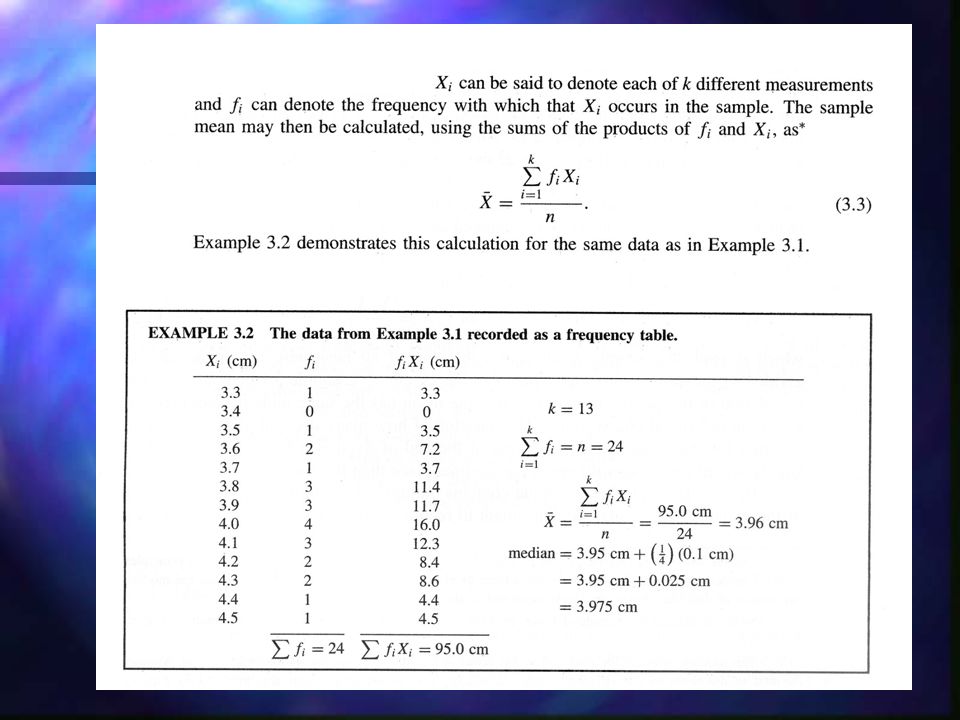
Median n The middle value when the measurements are arranged from lowest to highest. n 50% of the measurement lie above it and 50% fall below it. n Often used to measure the midpoint of a large set of measurement. n There is only 1 median n Not influenced by extreme measurements. n Applicable to quantitative data only.

8
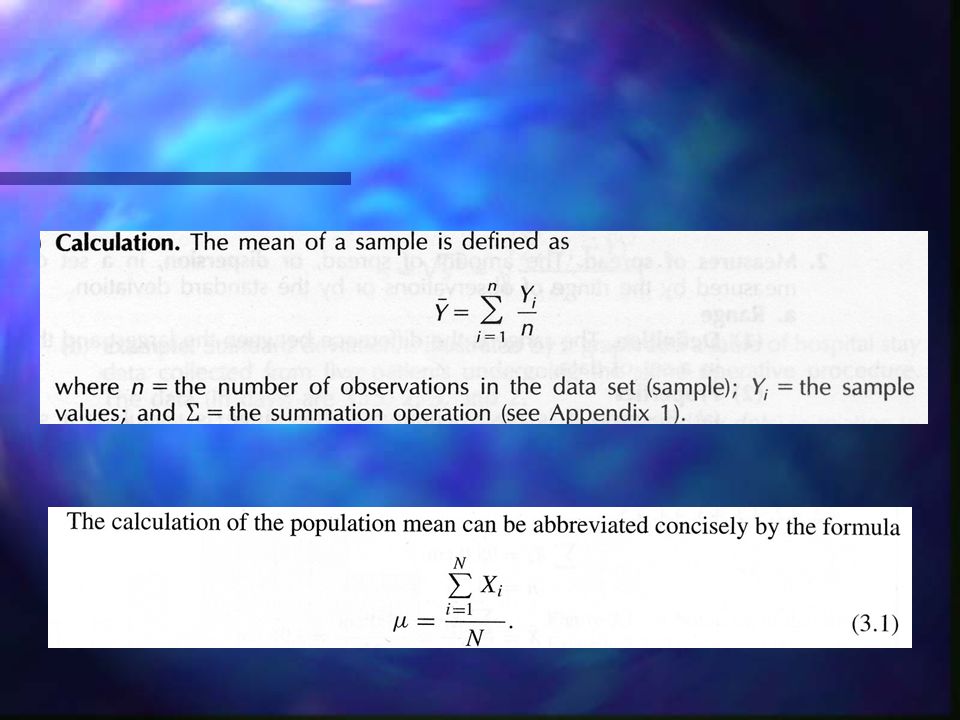
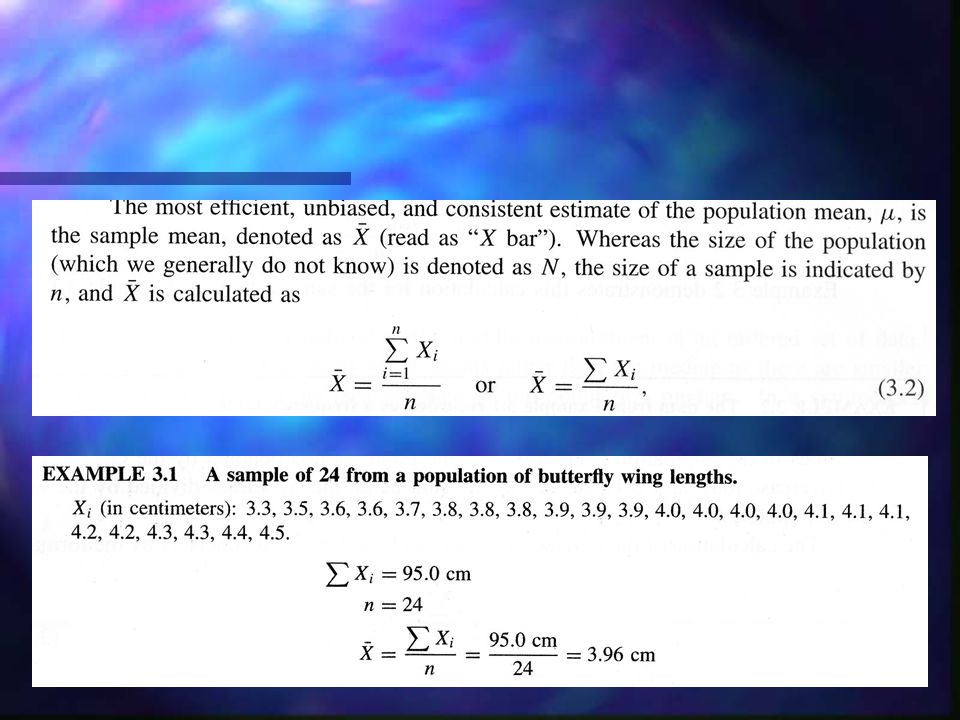
Mean n The sum of the measurements divided by the total number of measurements or better known as the average. n There is only 1 mean. n Value is influences by extreme measurements n Applicable to quantitative data only.

12
Trimmed Mean n The mean is influenced by extreme values ( Outliers ) n To reduce the effect of outliers which distort the mean value, a variation of the mean is introduced. n Trimmed mean drops the highest and lowest extreme values and averages the rest.

13
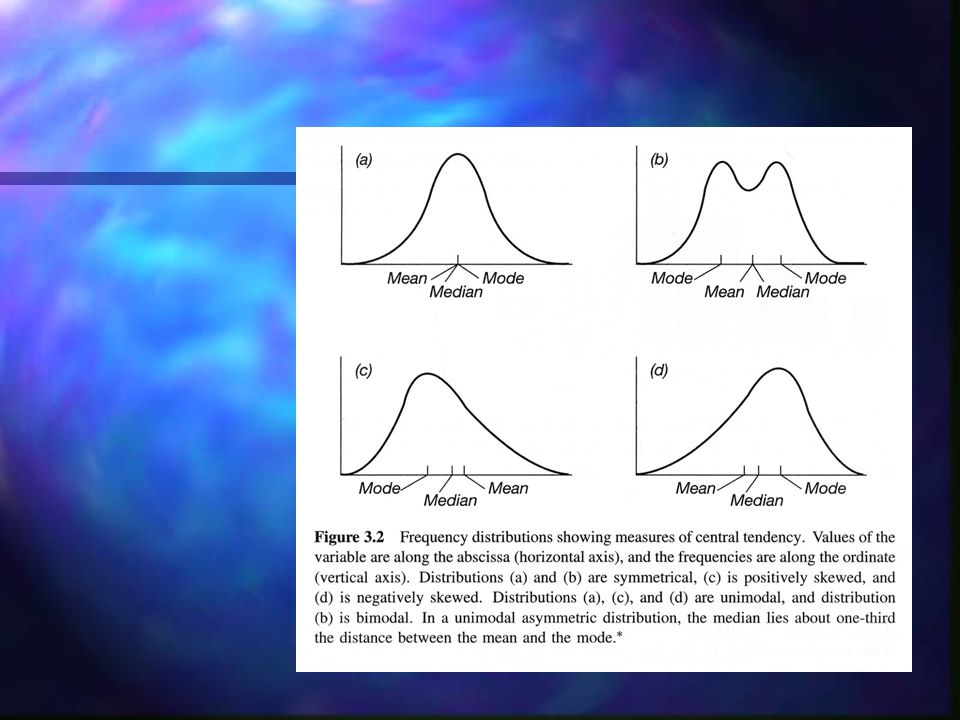
Skewness n Relationship of the mode, median, mean and trimmed mean is reflected through the skewness of the data. n Skewness of the data measures how the data is distributed. n Zero Skewness – symmetrical ( Mode = Median = Mean) n Positive Skewness – skewed to the right ( Mode < Median < Mean ) n Negative Skewness – skewed to the left ( Mode > Media > Mean )
 n Positive Skewness – skewed to the right ( Mode < Median < Mean ) n Negative Skewness – skewed to the left ( Mode > Media > Mean ).")
14
Skewness

16
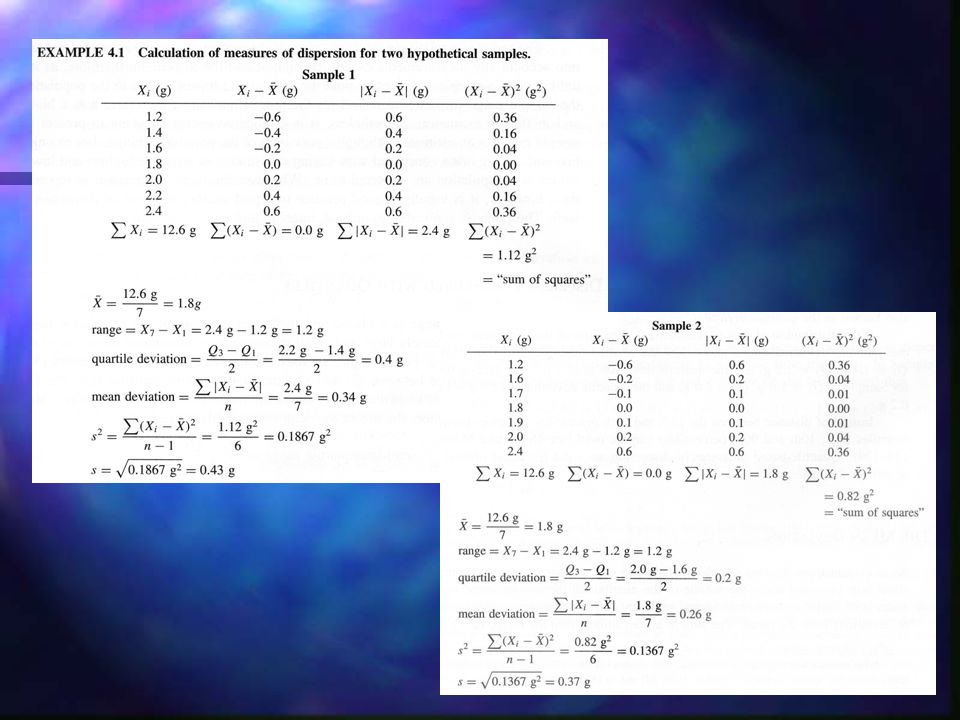
Measures of Variability / Dispersion n It is not sufficient to describe a data set using only measures of central tendency n Need to determine how dispersed / spread out the data is. n Measures of variability/spread includes –Range –Percentile / Quartile –Deviation / Standard Deviation (sisihan piawai) –Variance –Coefficient of variation
 –Variance –Coefficient of variation.")
17
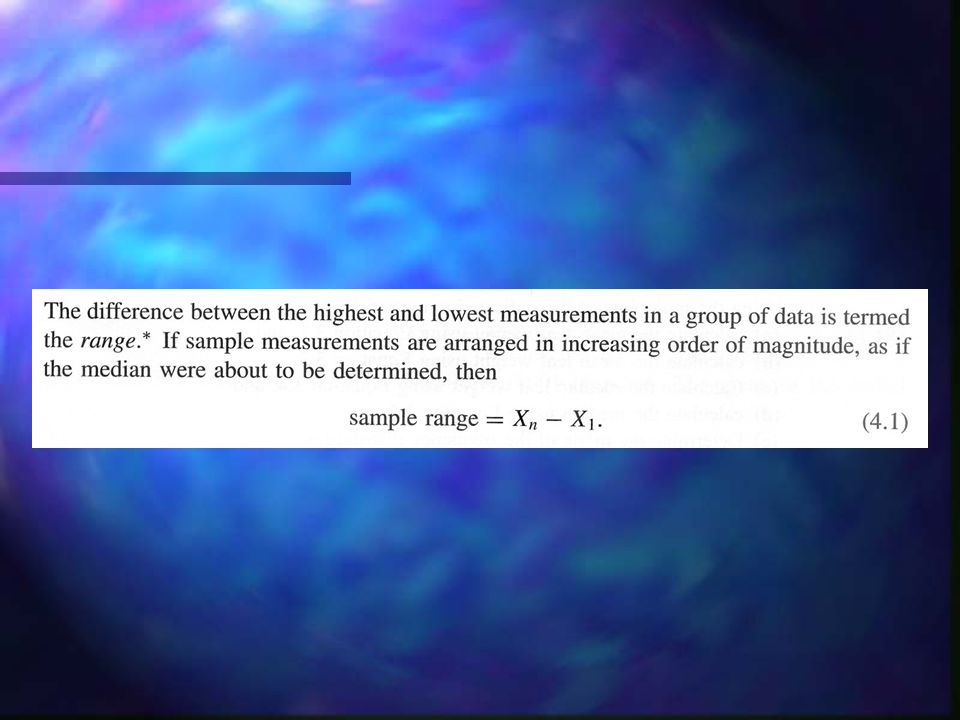
Range n The difference between the largest and the smallest measurement of the set. n It is easy to compute but very sensitive to outliers. n Does not give much information about the pattern of variability

20
Percentile / Quartile n The p th percentile of a set of n measurements arranged in order of magnitude is that value that has at most p% of the measurements below it and at most ( 100 – p ) % above it. n Example: 60 th percentile has 60% of the data below it and 40% above it. n Percentile of interest are the 25 th, 50 th, 75 th, percentiles often called the lower quartile, median, and upper quartile. n Interquartile range – difference between the upper and lower quartile

21
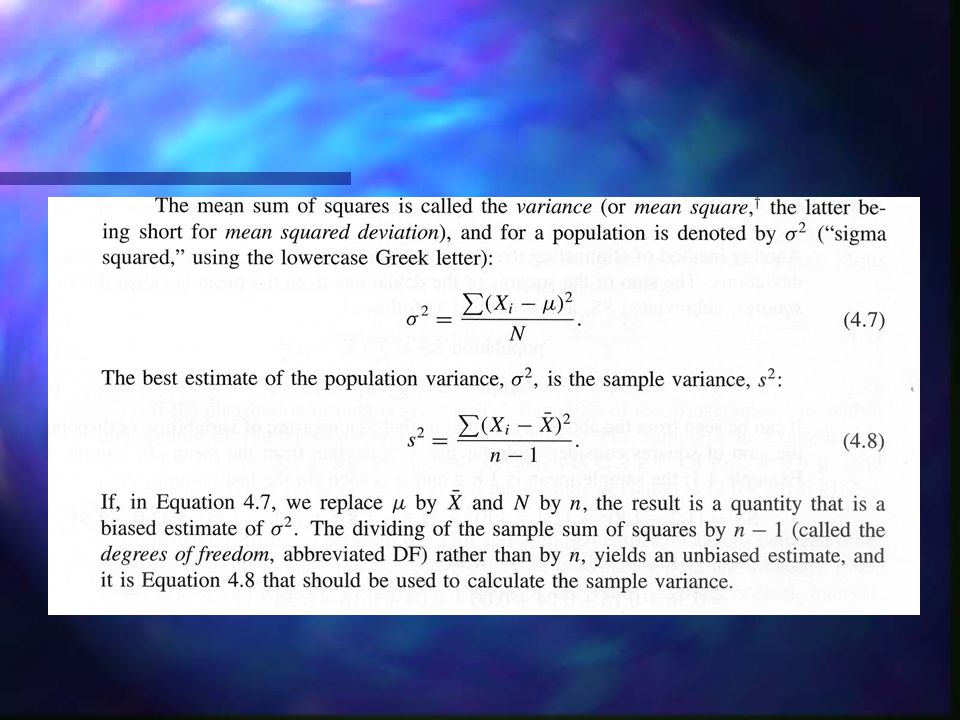
Variance and Standard Deviation n The variance of a set of n measurements y 1, y 2, …,y n with mean y is the sum of the squared deviations divided by n – 1. n The standard deviation of a set of measurement is defined to be the positive square root of the variance. n Both measure how spread out the data is from the mean.

28
Coefficient of Variation n Measures the variability in the values in a population relative to the magnitude of the population mean. n CV = Standard Deviation |Mean| |Mean| n The CV is a unit-free number, it is useful when comparing variation of different sets of data.

30
Boxplot n Top line –Maximum n 2 nd line –Upper Quartile n 3 rd line –Median n 4 th line –Lower Quartile n 5 th line –Minimum

Similar presentations


 2007 IUPUI SPEA K300 (4392) Outline: Numerical Methods Measures of Central Tendency Representative value Mean Median, mode, midrange Measures of Dispersion.>")


