Download presentation
Presentation is loading. Please wait.

1
AMERICAN POVERTY: NUMBERS AND DEMOGRAPHICS

2
THE OFFICIAL POOR

5
What is the Official Poverty Measure? A family is poor if their family income is less than the federal poverty threshold Poverty lines vary by family size and are adjusted for changes in food prices each year Based on the cost of a thrifty food budget for families of various sizes (the food budget is multiplied by 3) Poverty is a family concept—all persons in the same family have the same poverty status
 Poverty is a family concept—all persons in the same family have the same poverty status.")
7
2011 Poverty Standard for Selected Family Types Single Individual: Under 65: $11,702 Over 65: $10,788 One adult, two children: $18,123 Two Adults, two children: $22,811 Three adults, two children: $27,517 Four adults, two children: $31,643

8
Poverty Threshold 2011: Breaking It Down Family of Four with Two Children: $22,811 One third is the food budget for one year: $7,604 This is about $1,901 per year per family member. This is $158 per person per month $1,901 divided by 365 is a food budget of $5.21 per day per person in the family. $5.21 divided by three meals a day is $1.73 per meal.

9
This is a restricted money standard It does not take into consideration anything but specific types of cash, which means that near-cash assistance (e.g. food stamps, school meals, housing assistance) and even cash from the EITC and child support is not counted. The thresholds do not vary by the cost-of –living in states and cities. Does not conceptualize poverty in terms other than money. The debilitating side of poverty is about being marginalized, lacking empowerment and choices. Most of America’s poor, and the world’s poor, are caught in a trap. They lack opportunities, or may have let opportunities to control their destinies, pass them by.
 and even cash from the EITC and child support is not counted. The thresholds do not vary by the cost-of –living in states and cities. Does not conceptualize poverty in terms other than money. The debilitating side of poverty is about being marginalized, lacking empowerment and choices. Most of America’s poor, and the world’s poor, are caught in a trap. They lack opportunities, or may have let opportunities to control their destinies, pass them by..")
15
POOR AND LOW- INCOME POPULATIONS

18
The Impact of Age on Poverty

20
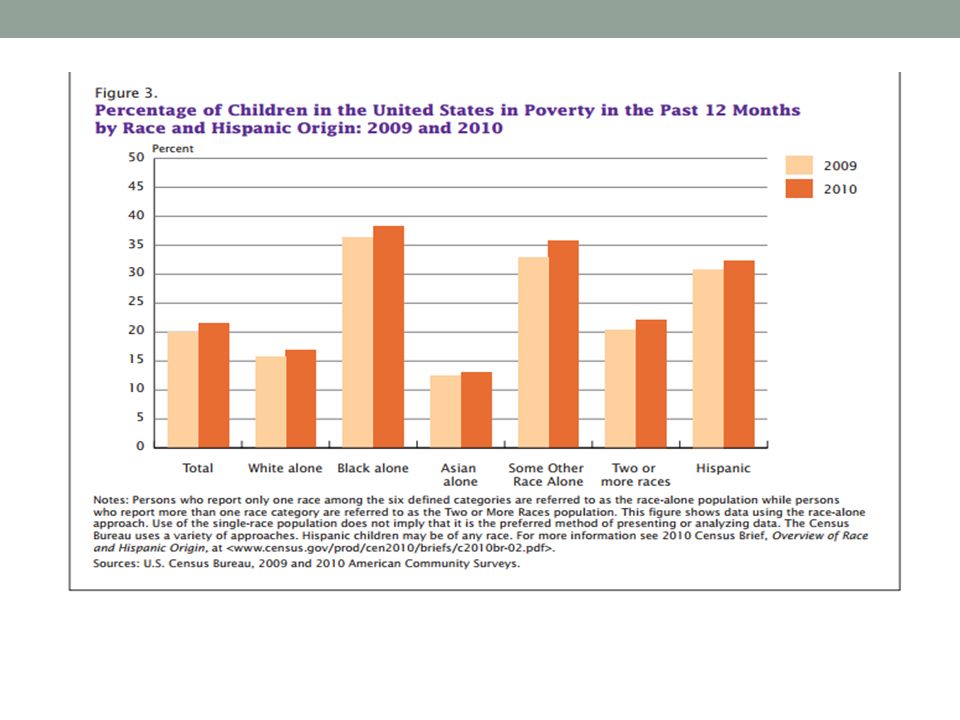
The Impact of Race and Ethnicity

22
The Impact of Family Type and Education

26
THE IMPACT OF AGE, RACE/ETHNICITY AND EMPLOYMENT ON POOR AND LOW- INCOME CHILDREN

30
Family Incomes and Employment

35
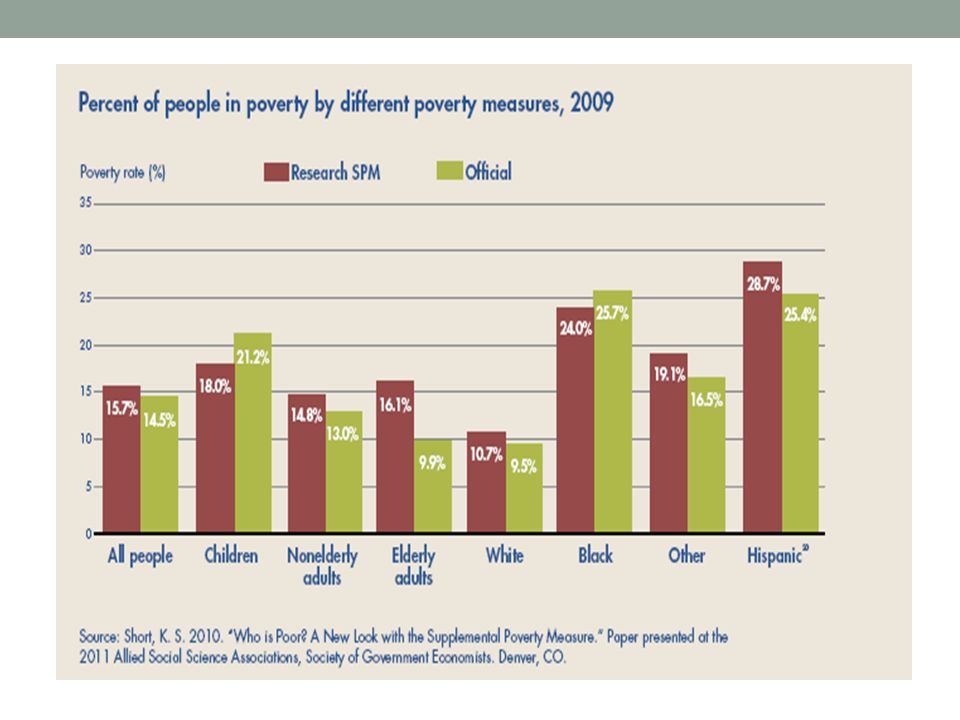
Improving the Measurement of American Poverty The definition of poverty has not changed since the measure was developed in the 1960s. The current measure is based on pre-tax family income; includes only cash income Does not include means-tested programs such as Food Stamps or Earned Income Tax Credit or child support and tax refunds. Not adjusted for work-related expenses Not adjusted for regional variation in costs of living (e.g., housing)
.")
40
THE ANTIPOVERTY IMPACT OF SOCIAL WELFARE SPENDING

45
SUPPLEMENTAL DATA

54
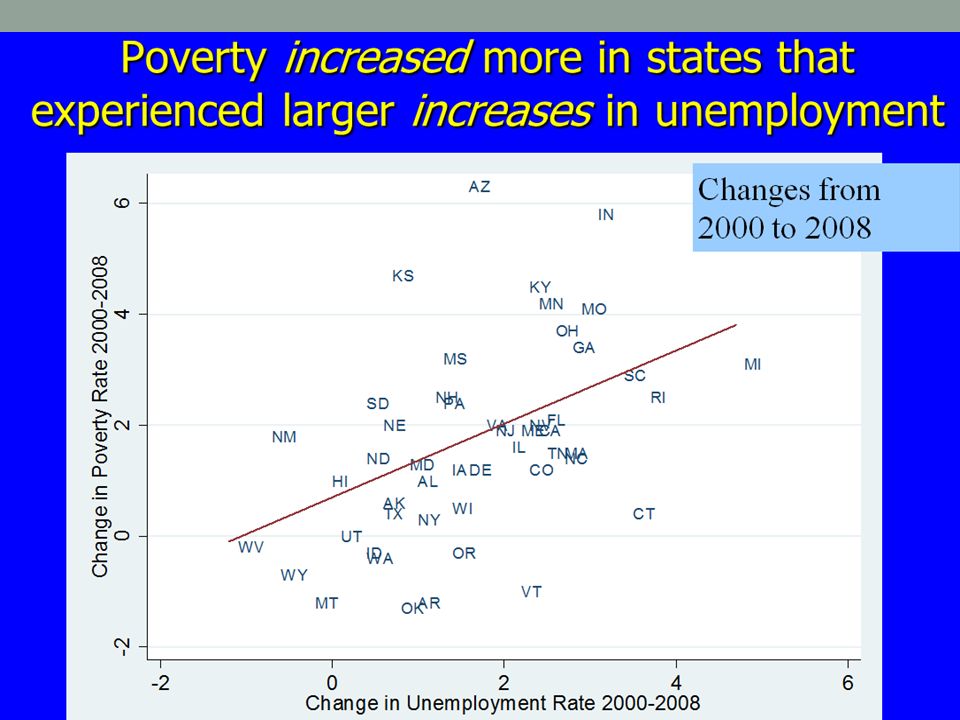
Unemployment Rate

59
Why Are Salaries Stagnant 1. The decline of unions and the resulting weakening of the bargaining power of labor. 2. The movement of well-paying jobs overseas. 3. Automation and technology advances which encourage a shift from workers to machines.

Similar presentations


 Lecture 20. Reading Assignment and Sources Reading Assignment: –Greenstein, “ The Earned Income Tax Credit: Boosting Employment,>")


