Download presentation
Presentation is loading. Please wait.

1
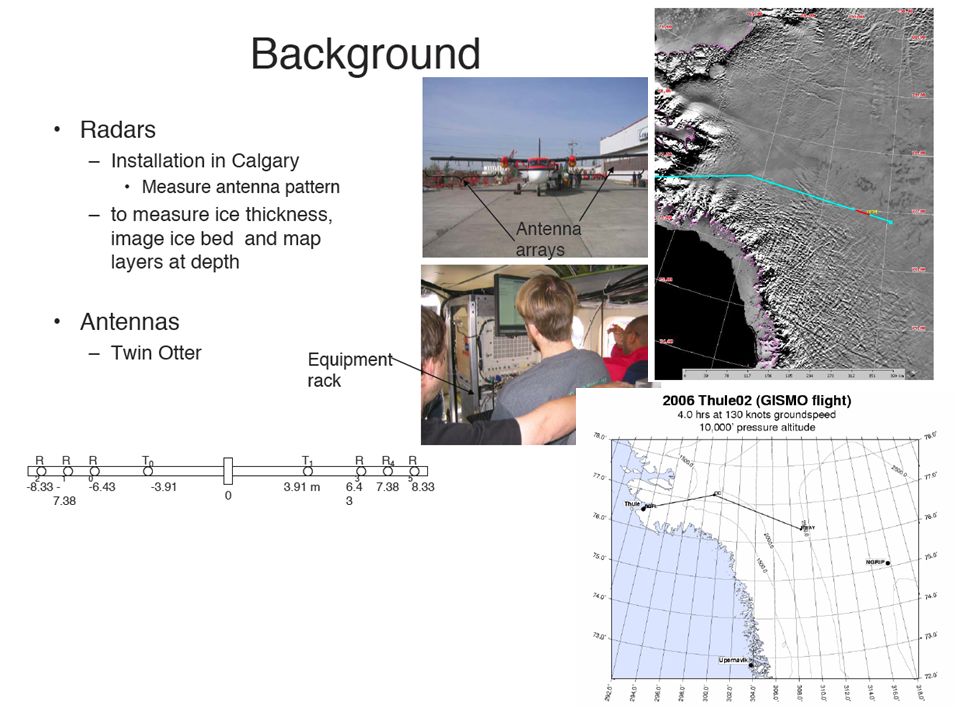
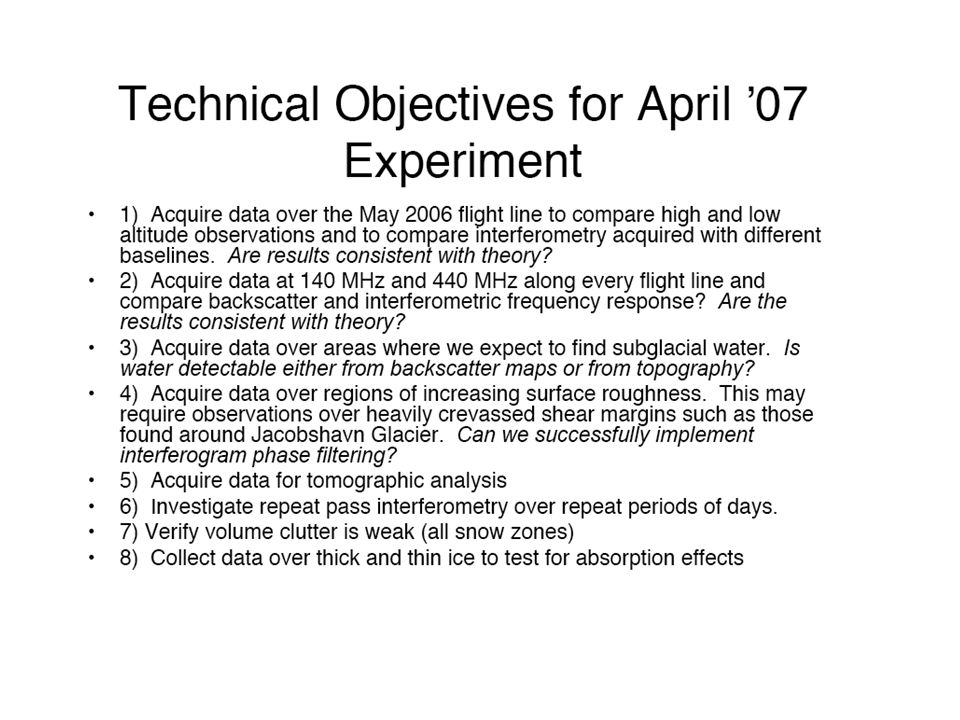
An Overview of Glaciers and Icesheets Mapping Orbiter (GISMO) & Global Ice Sheet Interferometric Radar (GISIR) Ohio State University University of Kansas Jet Propulsion Laboratory Vexcel Corporation Wallops Flight Facility, E.G.&G. Corporation University of Utah University of New Hampshire

3
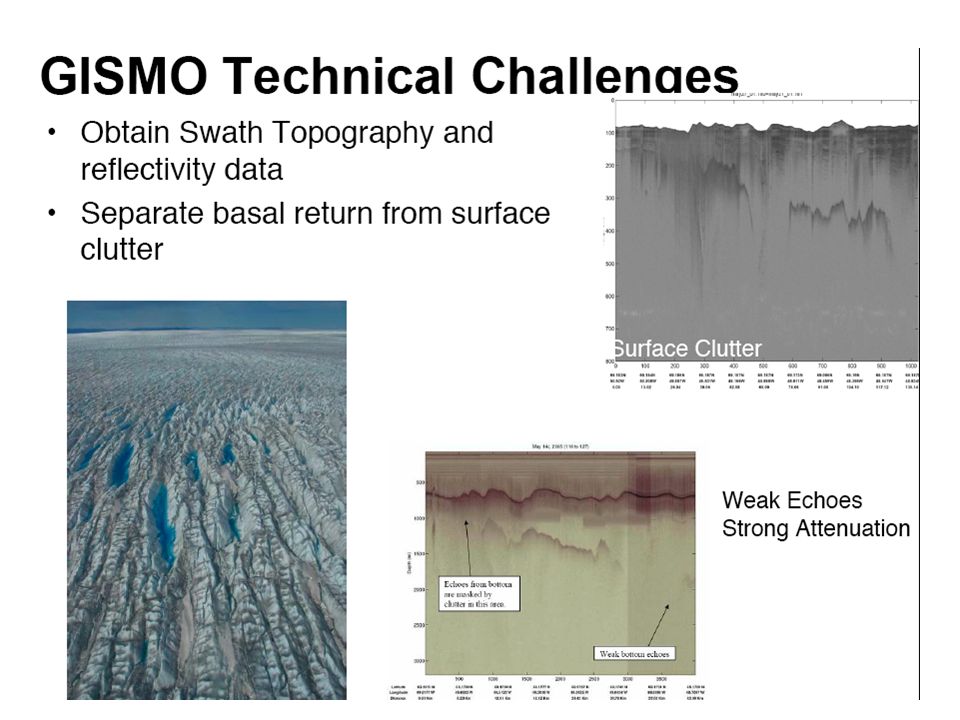
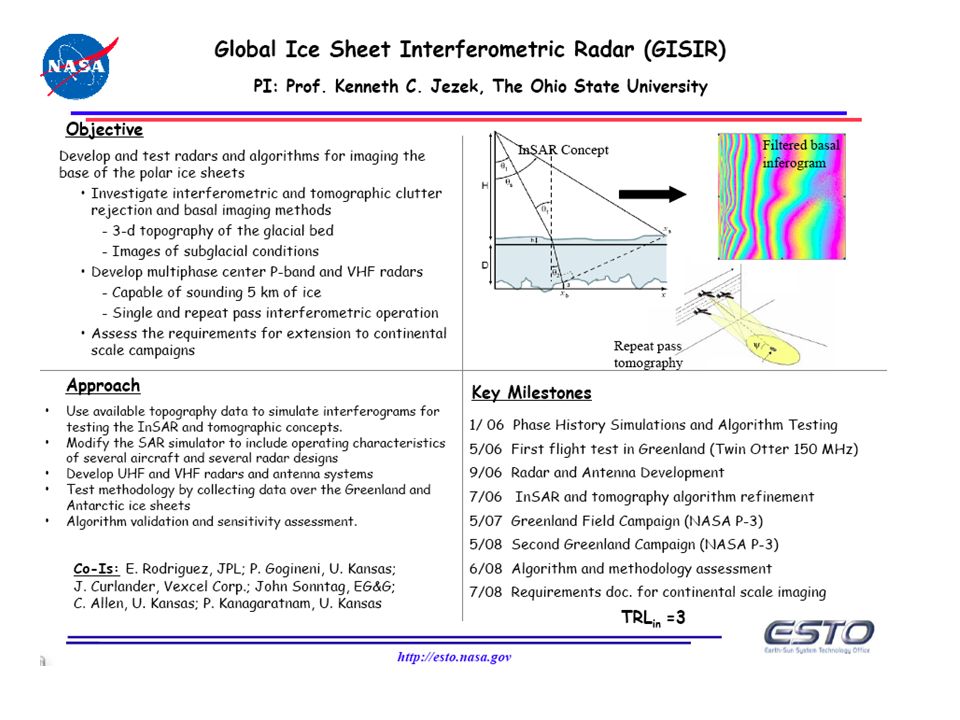
Why is Swath Sounding Hard? These two returns arrive at the same time and cannot be separated by single antenna timing alone. Need additional information to separate surface and subsurface. Solution: use interferometry + interferogram filtering Geometry of the two layer scattering model. H is the spacecraft height above a reference surface; h is the ice surface height above the reference surface; D is the average depth of the basal layer; d is the topographic variations of the basal layer; x b is the cross-track coordinate of the basal layer point under observation; and, x s is the cross-track coordinate of the surface point whose two-way travel time is the same as the two-way travel time for x b.

4
Spaceborne P-band Sounder 1 km Ice clutter K. Jezek, E. Rodriguez, P. Gogineni, A. Freeman, J. Curlander, X. Wu, J. Paden, and C. Allen. Glaciers and ice sheets mapping orbiter concept. Journal of Geophysical Research, 111(E06S20, doi:10.1029/2005JE002572), 2006.
,")
5
Interferometric Basal and Surface Signals Have Different Phase Rates Basal Interferogram Surface Interferogram Topography Weighted by Gain Range Distance (km)
")
6
UHF Fringe Spectrum No Antenna Pattern Interferogram spectra for signal to clutter ratio of 1, radar frequency of 430MHz, bandwidth of 6MHz, for the first 50 km of x b. The basal spectrum is colored orange. The remaining curves show the surface spectra for D = 1 km (black), D = 2 km (red), D = 3 km (green), D = 4 km (blue). Notice that the basal fringe spectrum depends very weakly on depth
, D = 2 km (red), D = 3 km (green), D = 4 km (blue). Notice that the basal fringe spectrum depends very weakly on depth.")
7
Results of Interferogram Filtering Simulation True basal interferogram Extracted basal interferogram from band-pass filtering

8
Retrieved Ice Thickness After Filtering +2500 m +2137 m 2850 m 1714 m ground range 70 km

Similar presentations


 Ohio State Univ., JPL, Univ. Kansas, VEXCEL Corp., E.G&G Corp., Wallops Flight Facility.>")


