Download presentation
Presentation is loading. Please wait.

1
Kevin T. Hill Fisheries Resources Division Southwest Fisheries Science Center

2
Historical overview Sardine population & mgmt since recovery Stock assessment process Assessment data Biology, Fisheries, Surveys 2010 assessment results Harvest policy & management issues

3
5-year averages of estimated sardine population biomass, AD 420-1970; Age-structured estimates shown in red; Extreme population variability even in absence of fishing; periods of peak abundance ~ 50-60 years link to environmental forcing is assumed Typical population dynamic for an ‘R-selected’ species: small body, rapid growth, early maturation, high fecundity, short generation time, and the ability to disperse offspring widely Sardine scale-deposition in the Santa Barbara Basin (Soutar & Isaacs 1969; Baumgartner et al. 1992). “Little Ice Age”
. Little Ice Age .")
5
Early Sardine Science & Management Intense fishery sampling, ageing with scales and otoliths; Catch-effort studies (lunar-month); Tagging studies (still the best available); Early efforts by CDFG biologists to set caps and limit reduction fishing; Agency responses to declining catch were mixed & conflicting; ‘Marine Research Committee’, later renamed ‘CalCOFI’, was established by CA legislature in 1949 to ‘study the sardine problem’; Actions by the CA legislature were too little and too late to avoid eventual moratorium 23 years after Monterey fishery collapsed CalCOFI Sampling
; Tagging studies (still the best available); Early efforts by CDFG biologists to set caps and limit reduction fishing; Agency responses to declining catch were mixed & conflicting; ‘Marine Research Committee’, later renamed ‘CalCOFI’, was established by CA legislature in 1949 to ‘study the sardine problem’; Actions by the CA legislature were too little and too late to avoid eventual moratorium 23 years after Monterey fishery collapsed CalCOFI Sampling")
6
Tagging (1935-1944)
")
7
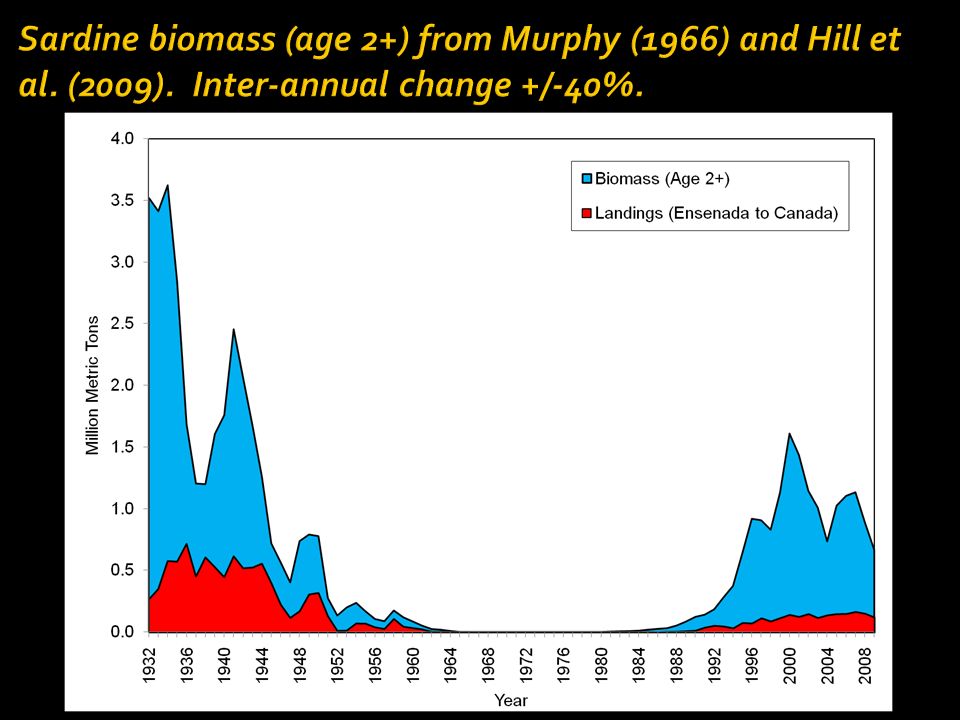
1980 s : low abundance, confined to SCA; minor fisheries in SCA & ENS 1990 s : Expansion offshore and north to Central California; CCA fishery begins; Pop’n growth = 33%; Sardine in OR, WA, and BC 2000 s : Fisheries in PNW Seasonal movements N-S, inshore/offshore San Pedro Ensenada Washington Oregon Monterey British Columbia 2000 s 90 s 80 s

8
Space-time distribution of Pacific sardine subpopulations (Felix-Uraga et al. 2004, 2005) WINTER SPRING SUMMERFALL SPRING
 WINTER SPRING SUMMERFALL SPRING.")
9
Biology: Age, Growth, Maturity Biology: Age, Growth, Maturity Fishery: Tonnage, Size & Age Composition Fishery: Tonnage, Size & Age Composition Abundance: Resource Survey, CPUE, Age & Size Composition Abundance: Resource Survey, CPUE, Age & Size Composition Population Dynamics Model: Birth, Growth, Reproduction, Death Reconstruct past population trend & productivity. Estimate present abundance for resource managers. Population Dynamics Model: Birth, Growth, Reproduction, Death Reconstruct past population trend & productivity. Estimate present abundance for resource managers. Stock Status Optimum Yield (socioeconomic and ecosystem considerations)
.")
11
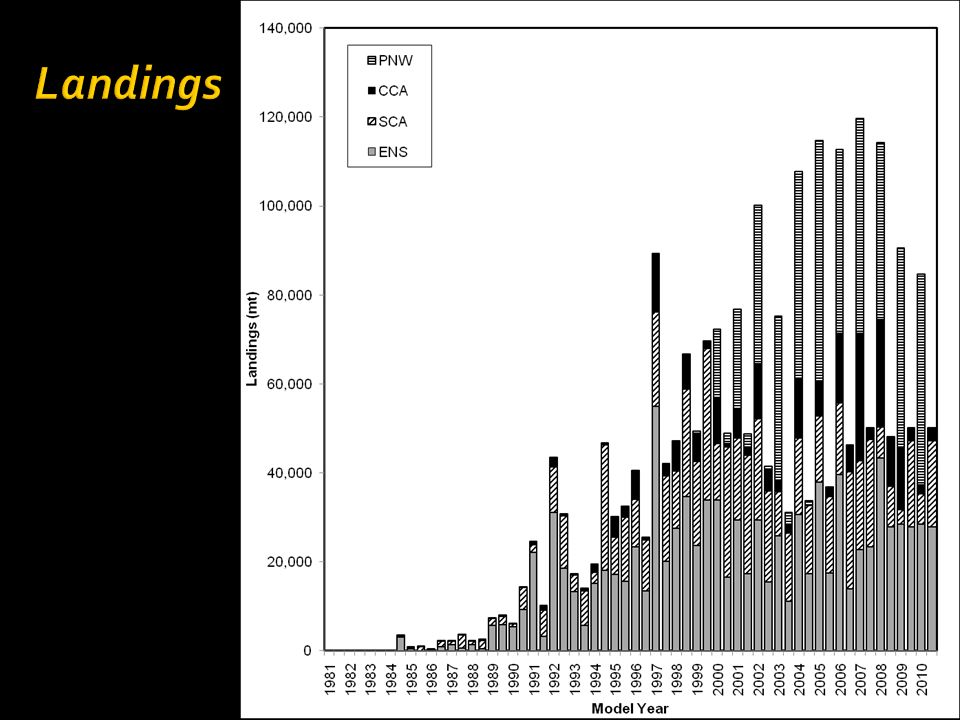
Fishery Data (tonnage, size, age of removals): Pacific Northwest (PNW) Central California (CCA) Southern California (SCA) Ensenada (ENS) Fishery-Independent Data (time series of abundance): CDFG & SWFSC egg production surveys: DEPM or TEP time series, depending on adult sampling; 1985-2010 West Coast Sardine Aerial Survey (industry funded): Current assessment includes estimates for OR-WA region, 2009 & 2010 Assessment Model: ‘Stock Synthesis’ (Richard Methot, NOAA) Fully integrated, forward-projecting, length and age-structured, highly flexible
: Pacific Northwest (PNW) Central California (CCA) Southern California (SCA) Ensenada (ENS) Fishery-Independent Data (time series of abundance): CDFG & SWFSC egg production surveys: DEPM or TEP time series, depending on adult sampling; West Coast Sardine Aerial Survey (industry funded): Current assessment includes estimates for OR-WA region, 2009 & 2010 Assessment Model: ‘Stock Synthesis’ (Richard Methot, NOAA) Fully integrated, forward-projecting, length and age-structured, highly flexible")
15
Length-at-ageWeight-at-length

16
Season 1 (Jul-Dec)Season 2 (Jan-Jun)
Season 2 (Jan-Jun)")
17
Season 1 (Jul-Dec) Season 2 (Jan-Jun)
 Season 2 (Jan-Jun)")
18
Low egg density (P 0 ); Spawning fraction ~10% (≤avg); Females slightly larger; SSB total = 105,220 mt; SSB female = 58,447 mt (0.42); Lowest DEPM biomass estimate since mid-1990s
; Spawning fraction ~10% (≤avg); Females slightly larger; SSB total = 105,220 mt; SSB female = 58,447 mt (0.42); Lowest DEPM biomass estimate since mid-1990s")
19
DEPM (female SSB) q = 0.1715 TEP (total SSB) q = 0.4568
 q = TEP (total SSB) q =")
20
SS model tuned prior to inclusion of aerial est.; Catchability fixed to q=1; Length comp fit with dome-shaped selectivity; Selectivity assumptions not explored during STAR, but inconsistent with PNW fishery selectivity which is fit to asymptotic shape 173,390 mt (0.4)1,236,910 mt (0.9)
1,236,910 mt (0.9)")
21
537,173 mt

22
Independent peer-review (NMFS and PFMC): Stock Assessment Review Panel (4-5 scientists) Scientific and Statistical Committee (~16 scientists) CPS Management Team (agency scientists) CPS Advisory Subpanel (fishing industry & 1 NGO rep) Management action: Pacific Fishery Management Council (PFMC) ▪ adopt assessment; apply harvest formula; allocate by season/sector NMFS Southwest Region (SWR) ▪ Proposed and final regulations published in Federal Register Catch monitoring and Enforcement ▪ (CDFG, ODFW, WDFW, NOAA) Season closure (NMFS-SWR)
: Stock Assessment Review Panel (4-5 scientists) Scientific and Statistical Committee (~16 scientists) CPS Management Team (agency scientists) CPS Advisory Subpanel (fishing industry & 1 NGO rep) Management action: Pacific Fishery Management Council (PFMC) ▪ adopt assessment; apply harvest formula; allocate by season/sector NMFS Southwest Region (SWR) ▪ Proposed and final regulations published in Federal Register Catch monitoring and Enforcement ▪ (CDFG, ODFW, WDFW, NOAA) Season closure (NMFS-SWR)")
23
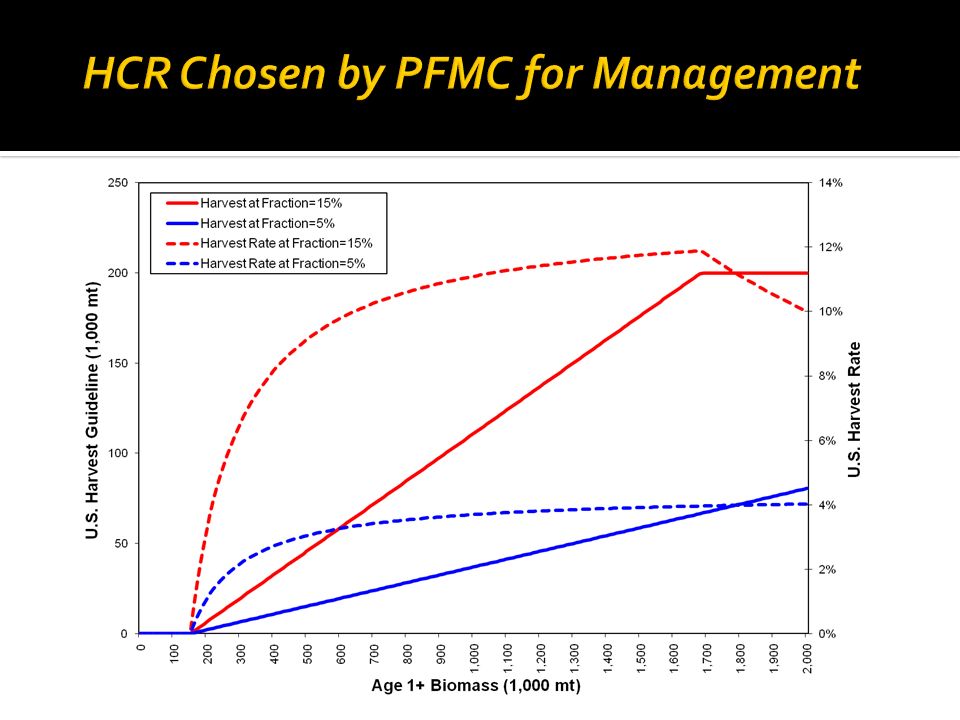
Stock biomass (age 1+, mt)Cutoff (mt) Harvest Fraction U.S. Distribution U.S. Harvest for 2011 (mt) 537,173150,0000.150.8750,526 HG 2010 = (BIOMASS 2009 – CUTOFF) FRACTION DISTRIBUTION To determine an appropriate (sustainable) FRACTION value: F MSY = 0.248649805(T 2 )−8.190043975(T)+67.4558326 where T ( o C) is the running average sea-surface temperature at Scripps Pier during the three preceding seasons (July-June), and exploitation FRACTION is bounded between 5% and 15%. Maximum catch allowed = 200,000 mt
 537,173150, ,526 HG 2010 = (BIOMASS 2009 – CUTOFF) FRACTION DISTRIBUTION To determine an appropriate (sustainable) FRACTION value: F MSY = (T 2 )− (T) where T ( o C) is the running average sea-surface temperature at Scripps Pier during the three preceding seasons (July-June), and exploitation FRACTION is bounded between 5% and 15%. Maximum catch allowed = 200,000 mt.")
25
Mean three- season SST (°C) at Scripps Equilibrium spawning biomass (mt) Maximum sustained yield (MSY) Spawning biomass at MSY (B MSY )F MSY (%) 16.5700,0009274,0000.04 17.02,700,000156,0001,272,0000.16 17.3>4,000,000346,0001,819,0000.26 The spawner-recruit model was used to estimate changes in deterministic maximum sustained yield (MSY) reference points due to changes in environmental conditions associated with three-season SST at SIO, with 16.5-17.3 ° C being the inter-quartile SST range since 1916:
 at Scripps Equilibrium spawning biomass (mt) Maximum sustained yield (MSY) Spawning biomass at MSY (B MSY )F MSY (%) , , ,700,000156,0001,272, >4,000,000346,0001,819, The spawner-recruit model was used to estimate changes in deterministic maximum sustained yield (MSY) reference points due to changes in environmental conditions associated with three-season SST at SIO, with ° C being the inter-quartile SST range since 1916:")
30
Sardine will continue to: have rapid fluctuations in abundance/distribution; be utilized by predators, including humans. Researchers and managers will: have lagged response to changes in the resource; depend on labor-intensive data collection and time series; require more funding to ‘do it right’ Approach: minimize risk through conservative harvest policies; design surveys & methods applicable to all CPS; strive for international management agreements

Similar presentations


 under the MSFD was defined as “Populations of all commercially exploited fish and shellfish.>")


 Members -- appointed –State governments –Federal Agencies.>")


