Download presentation
Presentation is loading. Please wait.

1
Oregon Spatial Analysis Project July 2006

2
Oregon SAP Background Information ODF Process What We Found What We Learned What We Plan to Modify

3
Annual Precipitation

4
Oregon Ecoregions

5
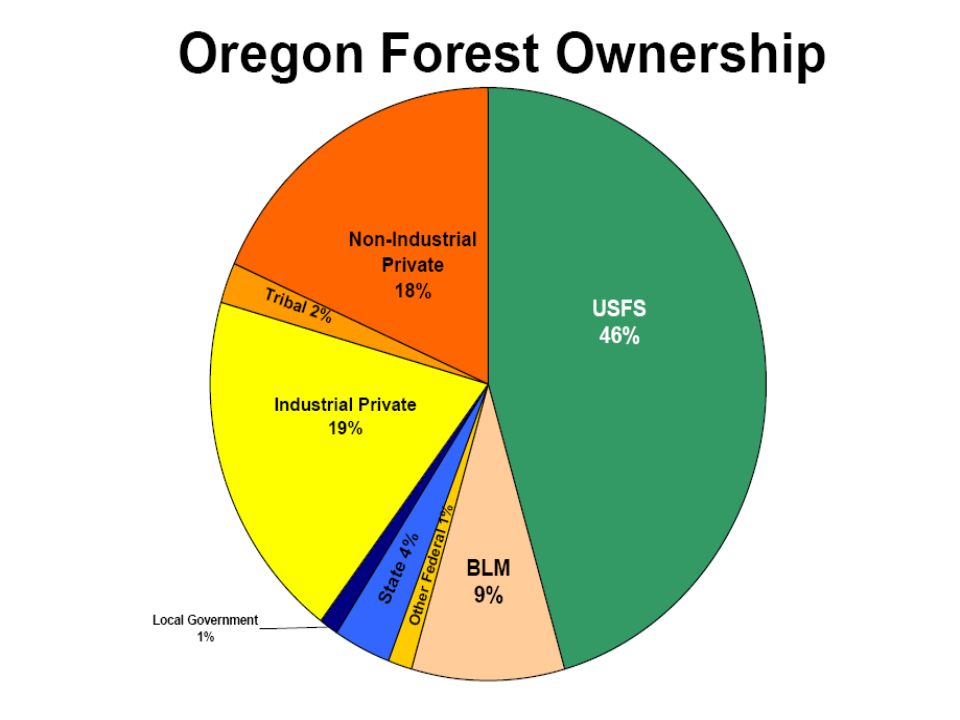
Forestland Ownership

8
Oregon SAP Background Information ODF Process What We Found What We Learned What We Plan to Modify

9
Wildfire Risk Developing Areas Insect and Disease Risk Riparian Corridors Conservation Areas Priority Zoning Forest Patch Public Drinking Water Private Forestland Activity Forest Soil Productivity Threatened & Endangered Species Proximity to Public Forestland Wetlands Topography

11
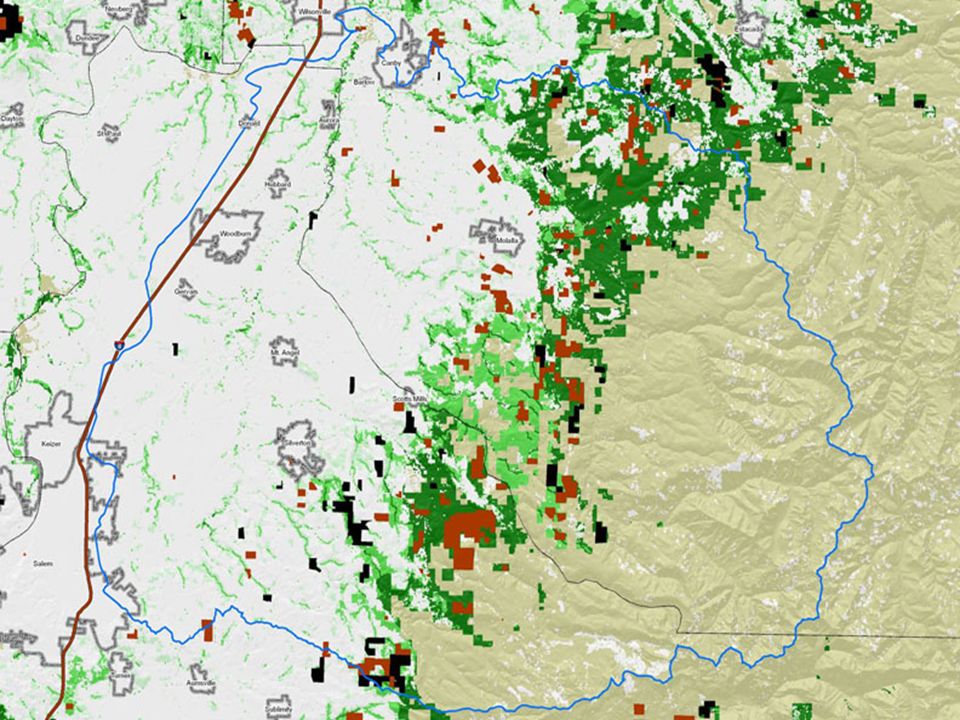
Management Plans Forest Stewardship Plans –1,294 Plans –712,748 Acres Tree Farm Plans –1,059 Plans –357,735 Acres

12
Oregon SAP Background Information ODF Process What We Found What We Learned What We Plan to Modify

13
Management Plans

14
Acres of Plans by Priority Number of Plans by Priority 21 % of NIPF in Management Plans

15
Oregon SAP Background Information ODF Process What We Found What We Learned What We Plan to Modify

16
What We Learned Strengths –Solid Concept –Visual products have value –Analysis straight forward and quick Weaknesses –Weighting multiple layers –Mixing agriculture and forest lands –Initial layers appear to focus of environmental factors –Data limitations

17
Weighting Data Layers 14 Layers Dilutes value of weight Example: With 14 layers, each worth 7.1%. Weighting one twice as important, 14.2%, has remaining layers at 6.6% each. Difference being 7.6% With 4 layers, each worth 25%. Weighting one twice as important, 50%, has remaining layers at 16.7% each. Difference being 33.3%

21
Data Layers Environmental –Forest Patches –T&E Species –Wetlands –Riparian Areas –Proximity to Public Lands –Priority Watersheds –Public Water Supply –Wildfire –Insect and Diseases Economic –Topography –Wildfire –Insect and Disease –Development Social –Public Water Supply –Development

22
Oregon SAP Background Information ODF Process What We Found What We Learned What We Plan to Modify

23
Stratifying Layers Regional Weighting

24
Data Layers Environmental –Forest Patches –T&E Species –Wetlands –Riparian Areas –Proximity to Public Lands –Priority Watersheds –Public Water Supply –Wildfire –Insect and Diseases Economic –Topography –Wildfire –Insect and Disease –Development –Soils –Distance to Milling Facilities –Proximity to Industrial Lands –Notification of Operations Social –Public Water Supply –Development –Percent of economy from forest sector –Hunting Opportunities

25
Regional Weighting Western Oregon Central & Eastern Oregon Southern Oregon

Similar presentations


 Requirements Statewide assessment of forest resource conditions.>")


 Theresa Kamau Kas Program Director - Manus.>")


 in New York Source: Cornell Cooperative Extension & NYS Department of Environmental Conservation.>")