Download presentation
Presentation is loading. Please wait.

1
RipStream: Quantifying stream temperature response to Oregon timber harvest practices Jeremy Groom 1, Liz Dent 2, Lisa Madsen 3 1 OSU Dept. of Forest Engineering Resources & Management 2 Oregon Dept. of Forestry, 3 OSU Dept. of Statistics

2
In a time before streams…

3
Oregon Department of Forestry Monitoring Landslides Pesticides Leave-tree HAP Shade Stream Temperatures Private Forests Division

4
Clean Water Act & OR Forestry Clean Water Act EPA DEQ (Water Quality Rules) Monitoring Forest Practices Act Board of Forestry
 Monitoring Forest Practices Act Board of Forestry")
5
RipStream – Riparian Function and Stream Temperature State and Private Forests joint effort Objective: Evaluate effectiveness of forest practices rules & strategies at protecting stream temperature, promoting riparian structure 33 Sites (18 Private, 15 State, Medium and Small F) Dent et al. 2008 JAWRA 44(4):803- 813
:")
6
Rules and Strategies Private: Forest Practices Act State: Northwest Oregon State Forest Management Plan State ForestsPrivate Forests 170 ft 25 ft20 ft 50 ft 70 ft Limited Entry No Cut No Cut Limited Entry Small & Medium F Small F Medium F

7
RipStream Study Design Design: 2 years pre-harvest, 5 years post harvest 1W 4W Control Treatment Downstream 2W POINT OF MAXIMUM IMPACT 3W

8
RipStream – Data and Questions What questions do we address first? –Regulatory: do our streams meet DEQ temperature standards post-harvest? –Function: what site characteristics are related to temperature change post-harvest? Years of data collection - Stream temperature - Shade - Channel morphology (gradient, widths, etc.) - Riparian vegetation (trees, shrubs)
 - Riparian vegetation (trees, shrubs).")
9
DEQ Water Temperature Standard Biologically-Based Numeric Criteria – were stream temperatures raised above 16 C or 18 C? Not really Analysis: Relatively straightforward Protecting Cold Water (PCW) – were streams warmed by > 0.3 C? Yes, on private (not State) streams Analysis: Complex
 – were streams warmed by > 0.3 C. Yes, on private (not State) streams Analysis: Complex.")
10
7DayMax “Temperature” = 7-day moving average of maximum daily temperatures Day: 1 2 3 4 5 6 7 8 9 10 11 Temp: 11 12 10 11 9 8 9 9 10 10 9 9.7 9.4 10.0 7DayMax:

11
Numeric Criteria Is analysis guidance available? YES Numeric Criteria exceedance = Any single summer 7DayMax temperature value exceeds 16 C or 18 C Natural: Control probes 1W & 2W Potential harvest effect: Treatment probe 3W

12
Numeric Criteria – What’s the big deal? Widespread WQ rule type EPA guidance (2003) for PNW states Lots of effort & research Opportunity for evaluation
 for PNW states Lots of effort & research Opportunity for evaluation.")
13
Numeric Criteria Results: 16 C Total Number of Sites: 33 – 18 sites exceeded 16 C Of those 18 sites: – 3 sites = pre-harvest only – 10 sites = control (1W, 2W) and treatment (3W) probes during the same year or years – 3 sites = control probes during pre-harvest years; treatment probes during post-harvest year(s) – 2 sites = treatment probe post-harvest only No strong indication that standards exceeded
 and treatment (3W) probes during the same year or years – 3 sites = control probes during pre-harvest years; treatment probes during post-harvest year(s) – 2 sites = treatment probe post-harvest only No strong indication that standards exceeded")
14
Protecting Cold Water (>0.3 C) Is analysis guidance available? NO. Lacking in other states Collaboration with DEQ Analysis question: For a specific day, has stream temperature increased by > 0.3 C?

15
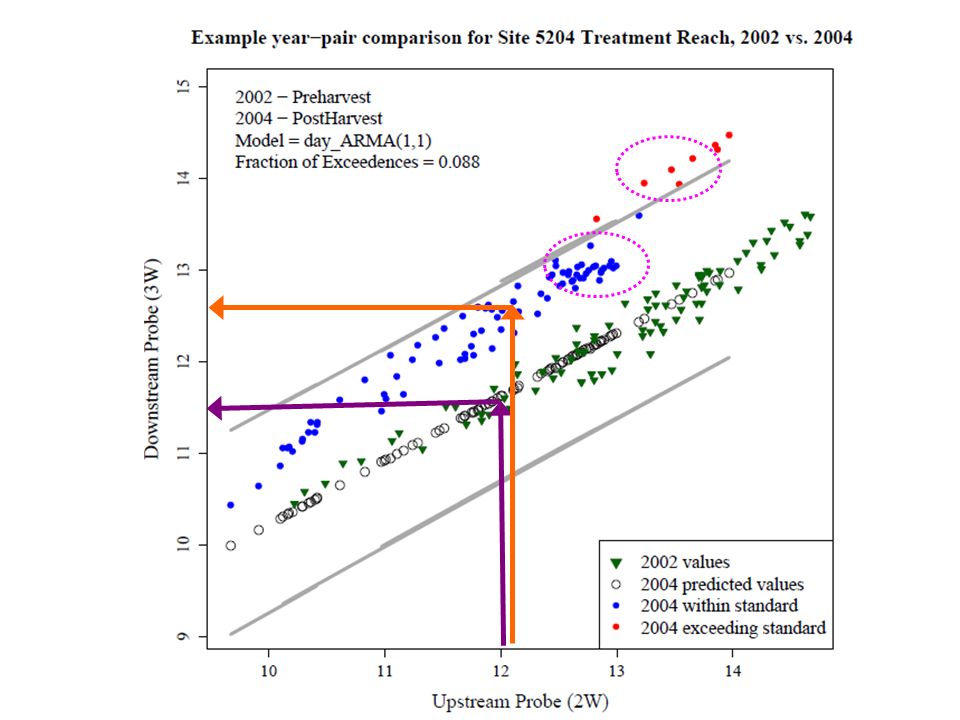
PCW analysis Looking for change in relationship (e.g., Treatment Reach = 2W and 3W) Comparing pairs of years (e.g., 2002 & 2004) within a reach (e.g., Upstream Control) Years are either pre-harvest or post-harvest (can compare pre-pre, pre-post, post-post)
 Comparing pairs of years (e.g., 2002 & 2004) within a reach (e.g., Upstream Control) Years are either pre-harvest or post-harvest (can compare pre-pre, pre-post, post-post)")
17
PCW – Analysis Path 1) Which reach year-pair comparison “exceeded” PCW? 2) Created & compared explanatory models of exceedance patterns – Examined combinations of regulatory distinctions (medium & small streams, State and Private lands) – Also examined comparison timings (e.g., pre- harvest to post-harvest)
 Created & compared explanatory models of exceedance patterns – Examined combinations of regulatory distinctions (medium & small streams, State and Private lands) – Also examined comparison timings (e.g., pre- harvest to post-harvest).")
18
3 reaches X 3 time periods = 9 groups Study Design and the PCW Pre-pre Pre-post Post-post Upstream Control Treatment Downstream 1W 4W 2W 3W FLOW 614 comparisons total 65 exceedances

19
Models Main Models 1) Null (all categories equal) 2) Reaches differ 3) Timing differs 4) Everything differs 5) Pre-post treatment differs 6) Pre-post Private treatment differs Upstream Control Treatment Downstream Pre-pre Pre-post Post-post Best State Forest Model ?
 Null (all categories equal) 2) Reaches differ 3) Timing differs 4) Everything differs 5) Pre-post treatment differs 6) Pre-post Private treatment differs Upstream Control Treatment Downstream Pre-pre Pre-post Post-post Best State Forest Model")
20
Best models TOP MODEL 40.2% 4.6%

21
Conclusions (Regulatory) Numeric Criteria – OK(?) PCW – increase in exceedance frequency on Private streams in general PCW – State OK
 Numeric Criteria – OK( ) PCW – increase in exceedance frequency on Private streams in general PCW – State OK")
22
Functional Analysis Study scope: Preharvest and two years postharvest 33 sites Questions: What factors influence changes in Treatment Reach temperature? Magnitude of temperature change?

23
What are we quantifying? Changes in temperature (downstream – upstream) Averaged daily values (July 15 – Aug 23) – Maximum – Minimum – Average – Flux 1W 2W 3W 2W-1W = Change in Control Reach 3W-2W = Change in Treatment Reach
 Averaged daily values (July 15 – Aug 23) – Maximum – Minimum – Average – Flux 1W 2W 3W 2W-1W = Change in Control Reach 3W-2W = Change in Treatment Reach.")
24
What factors control Treatment Reach temperature change? Gradient Elevation Reach length Control reach temperature change Azimuth Watershed area 1W 2W 3W Shade

25
Approach 1)Determine appropriate statistical analysis Linear mixed-effects regression 2)Develop competing explanations (models) of how temperature change controlled 18 models, ranked AIC 3) Determine which explanation performed best 4) Examine model results
Determine appropriate statistical analysis Linear mixed-effects regression 2)Develop competing explanations (models) of how temperature change controlled 18 models, ranked AIC 3) Determine which explanation performed best 4) Examine model results")
26
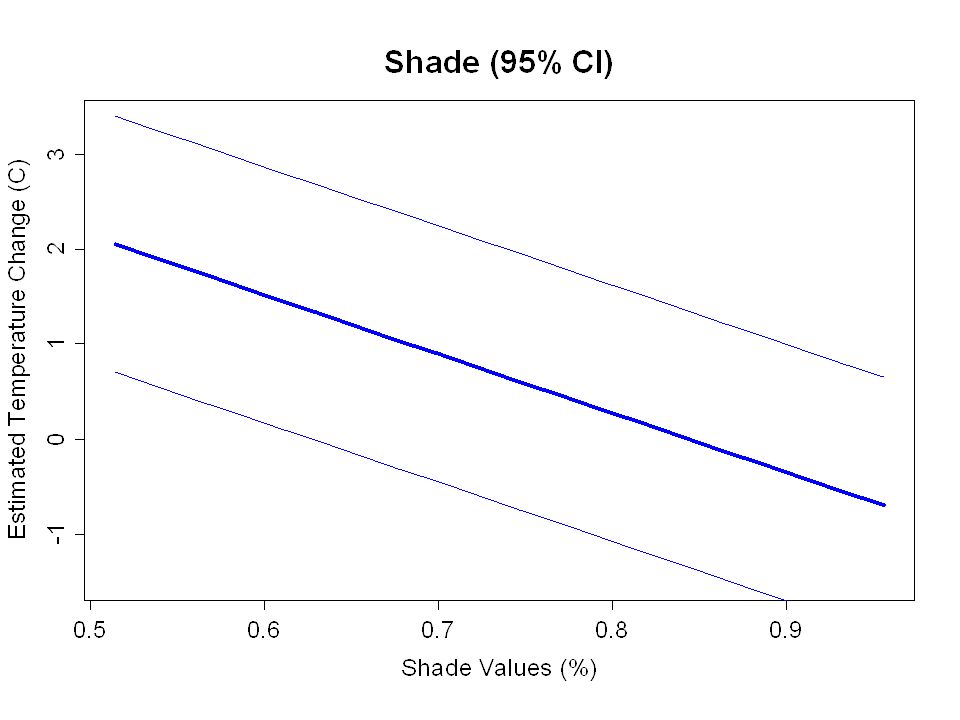
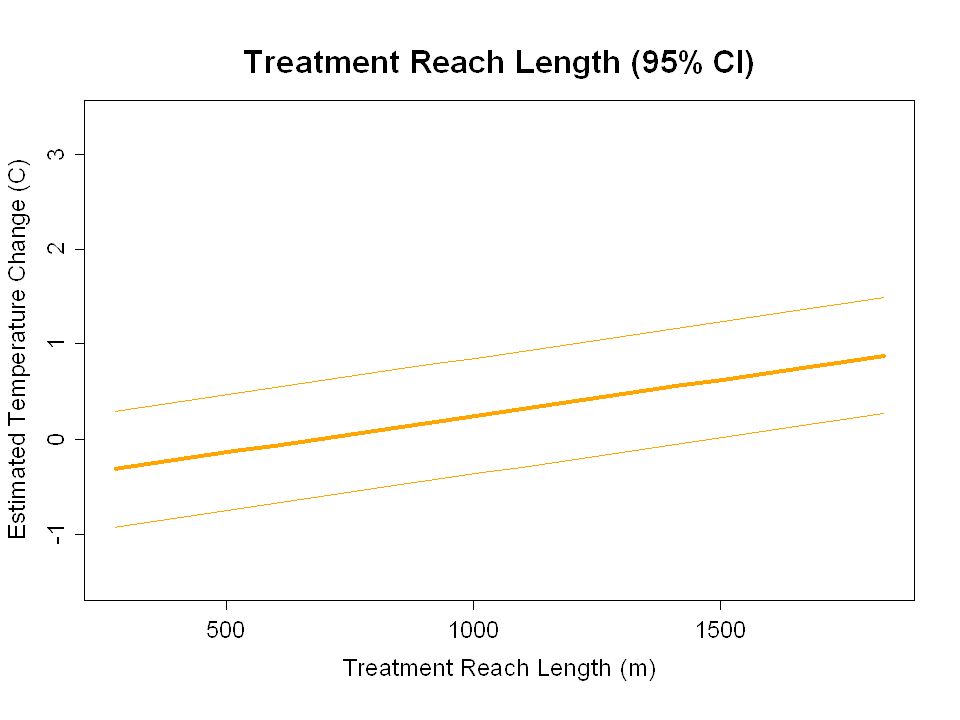
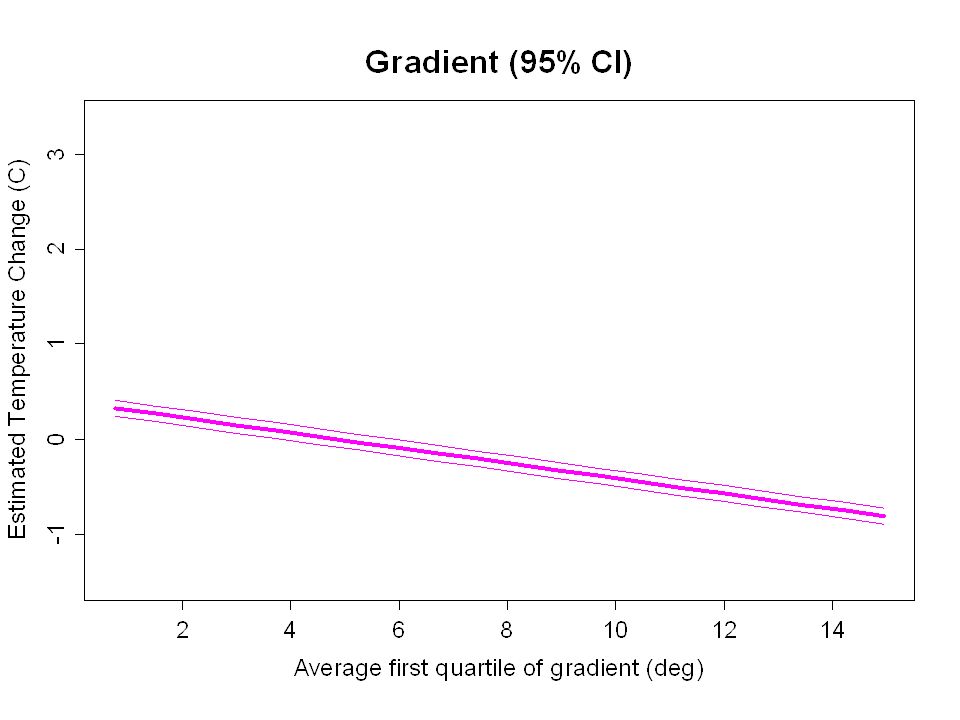
Best model: Change in maximum temperatures explained by: -Temperature change in control reach -Treatment reach length -Gradient -Shade Random: ~ Intercept + Control Temperature|Site Model values statistically significant Models without shade performed poorly Maximum Temperatures

30
Other Temperature Metrics Minimum Temperature: Same top model, same behavior of variables (not as strong) Average Temperatures: ditto Flux: Increased daily fluctuations with less shade Implication: Reductions in shade occurred, linked to increase in daily temperature maximum, minimum, average, and flux
 Average Temperatures: ditto Flux: Increased daily fluctuations with less shade Implication: Reductions in shade occurred, linked to increase in daily temperature maximum, minimum, average, and flux")
31
Shade Pre & Post Harvest

32
Partial Residual Plot for 33 Sites

33
Results summary 1) Shade changed and related to temperature change 2) Other parameters seem reasonable 3) Shade is important & needs further exploration -BA, height, blowdown
 Shade changed and related to temperature change 2) Other parameters seem reasonable 3) Shade is important & needs further exploration -BA, height, blowdown")
34
Next steps Complete & publish current analysis Next analysis: 5 yrs post harvest – Did temperature patterns remain? – Did shade recover? – More detailed examination of vegetation and shade

35
Liz Dent (ODF) & Joshua Seeds (DEQ) Private landowners PF monitoring staff (Marganne Allen, Jerry Clinton, Kevin Nelson, Kyle Abraham, Seasonal Work Force, Stewardship Foresters) State Forests Program Staff (Jeff Brandt, District Foresters, Field Foresters) Review Committee Members EPA 319 program Acknowledgements
 & Joshua Seeds (DEQ) Private landowners PF monitoring staff (Marganne Allen, Jerry Clinton, Kevin Nelson, Kyle Abraham, Seasonal Work Force, Stewardship Foresters) State Forests Program Staff (Jeff Brandt, District Foresters, Field Foresters) Review Committee Members EPA 319 program Acknowledgements")
Similar presentations


 Watershed Councils Stream Biomonitoring Study Michael Mulvey Oregon Department of Environmental Quality.>")


 Chapter 14 Introduction to Multiple Regression.>")

