Download presentation
Presentation is loading. Please wait.

1
PHYSICAL MAPPING AND POSITIONAL CLONING

2
Linkage mapping – Flanking markers identified – 1cM, for example Probably ~ 1 MB or more in humans Need very many families to get closer than this in human, or very large populations

3
What to Do Next? Identify genes in this region Then determine what is the gene of interest

4
What to do next? In 1990, clone region around markers, make physical map(s), look for genes experimentally In 2000, use better physical maps, at least in some organisms In 2010, use bioinformatic knowledge, experimental proof still necessary
, look for genes experimentally In 2000, use better physical maps, at least in some organisms In 2010, use bioinformatic knowledge, experimental proof still necessary.")
5
Physical Mapping A physical map is primarily based on the locations of landmarks along a DNA molecule and units of distance are expressed in base pairs.

6
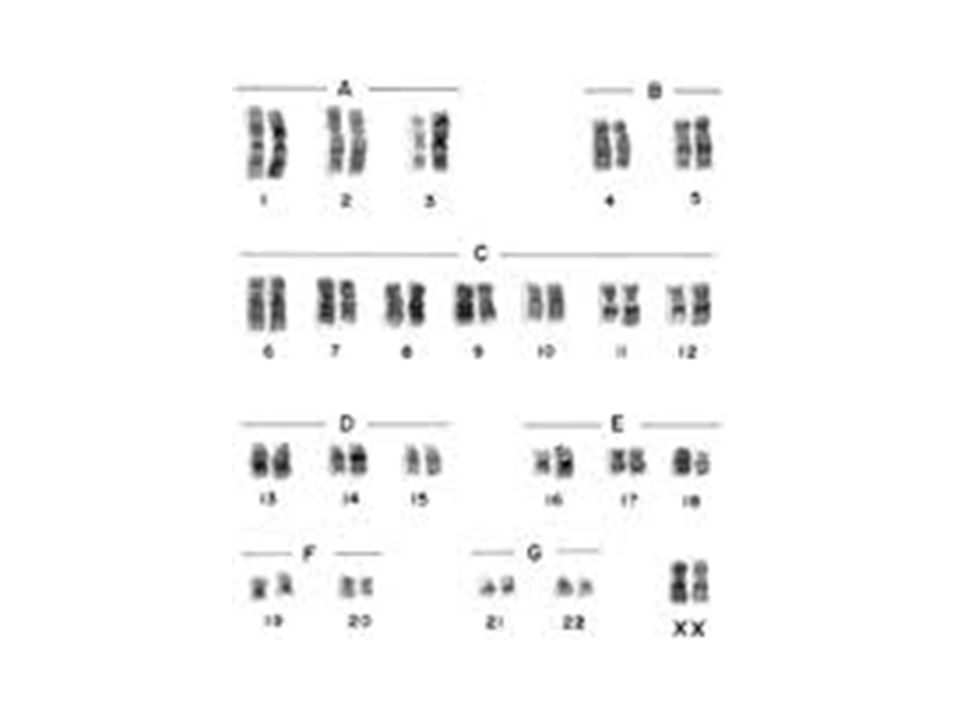
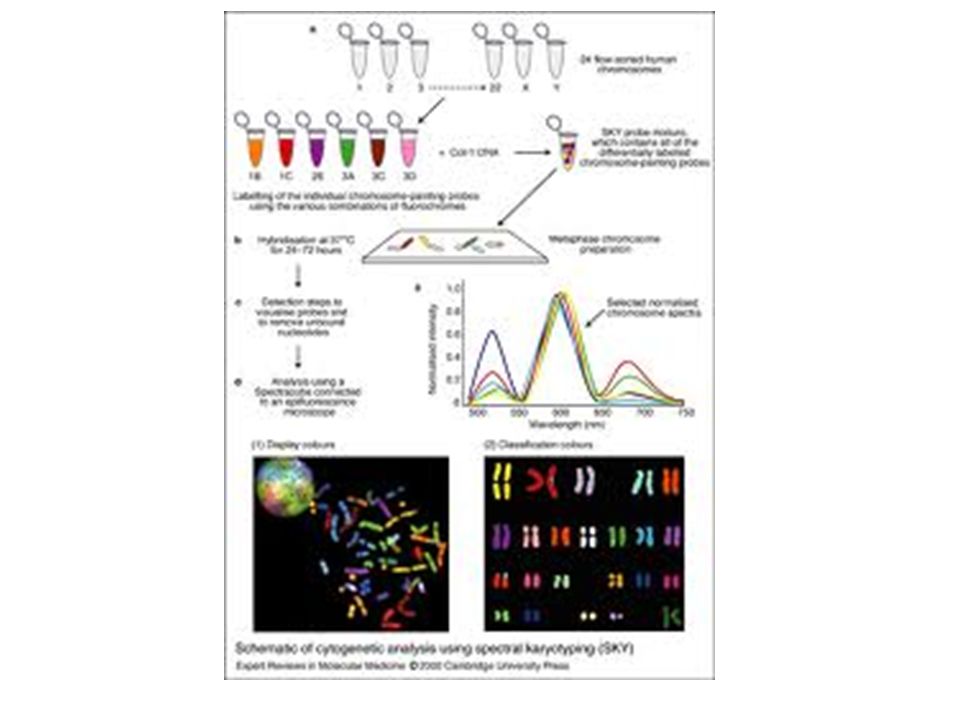
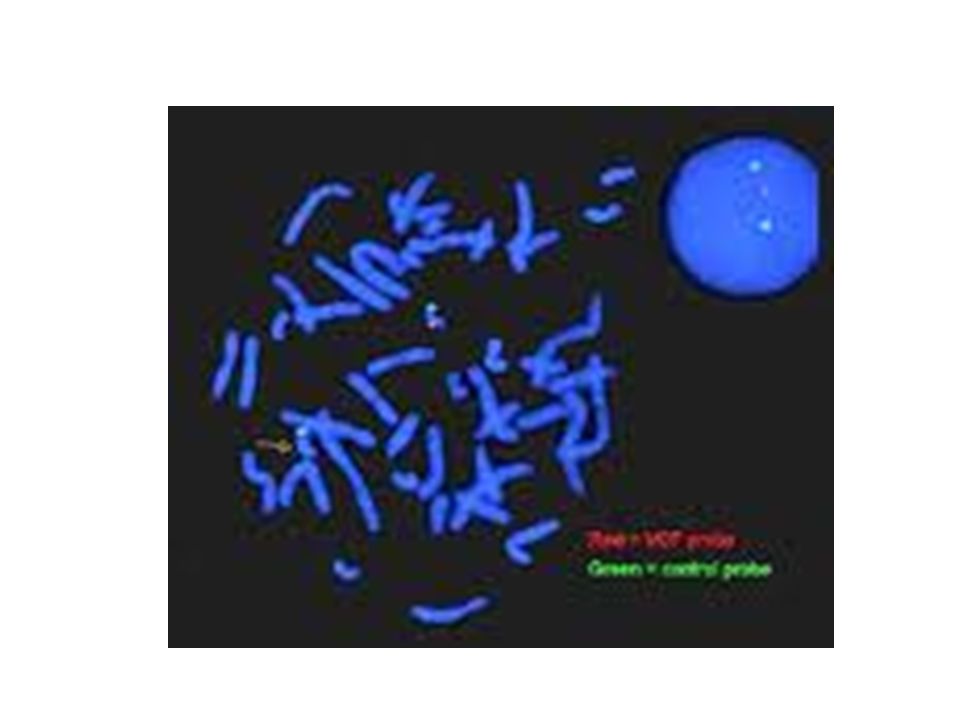
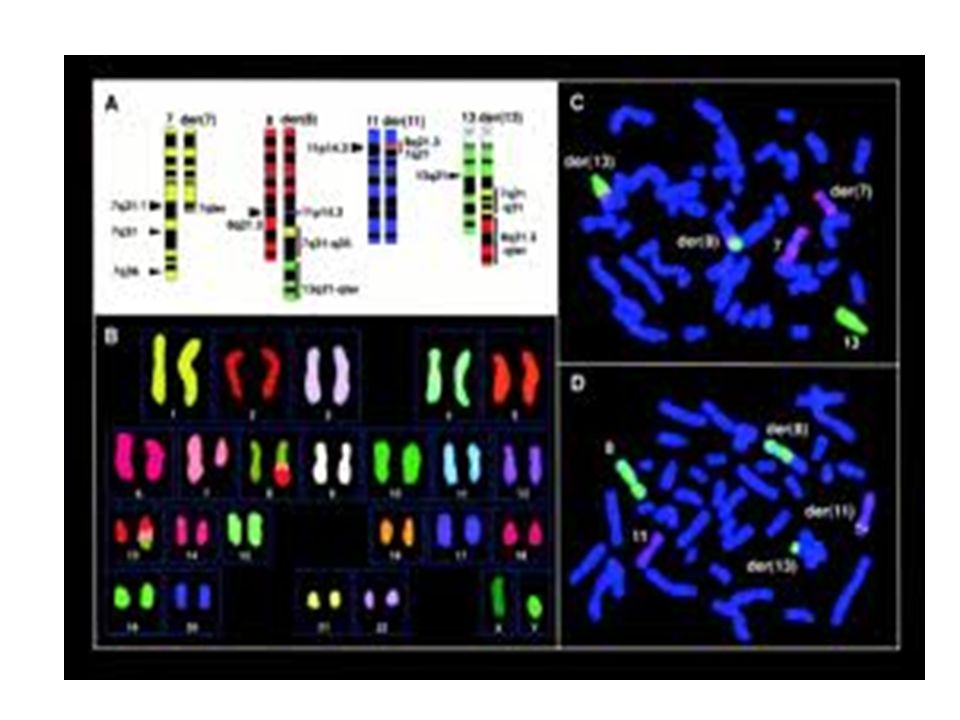
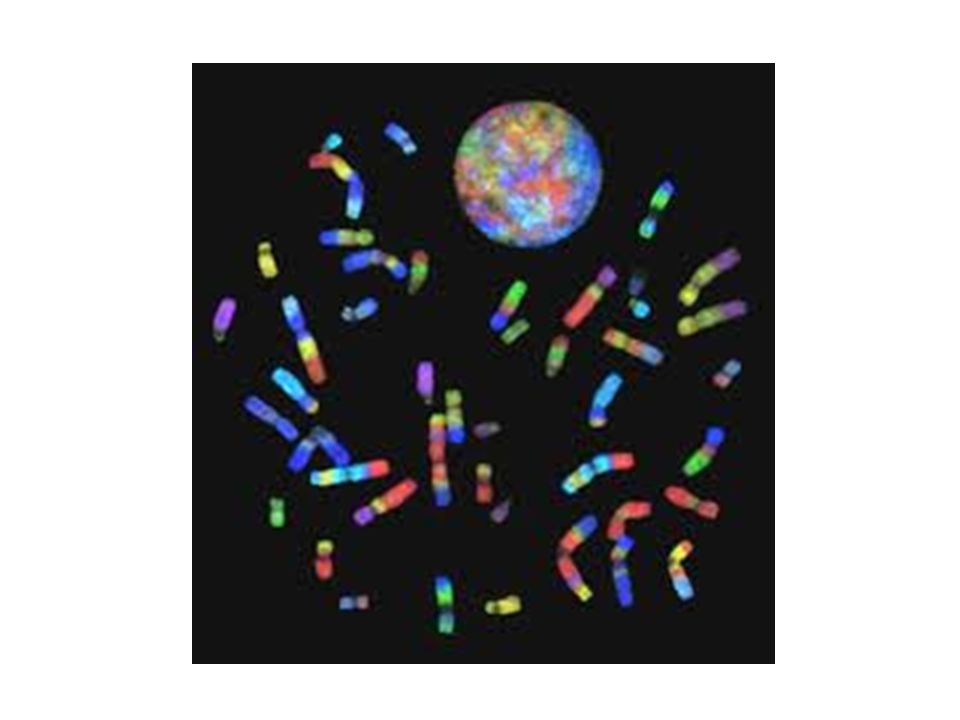
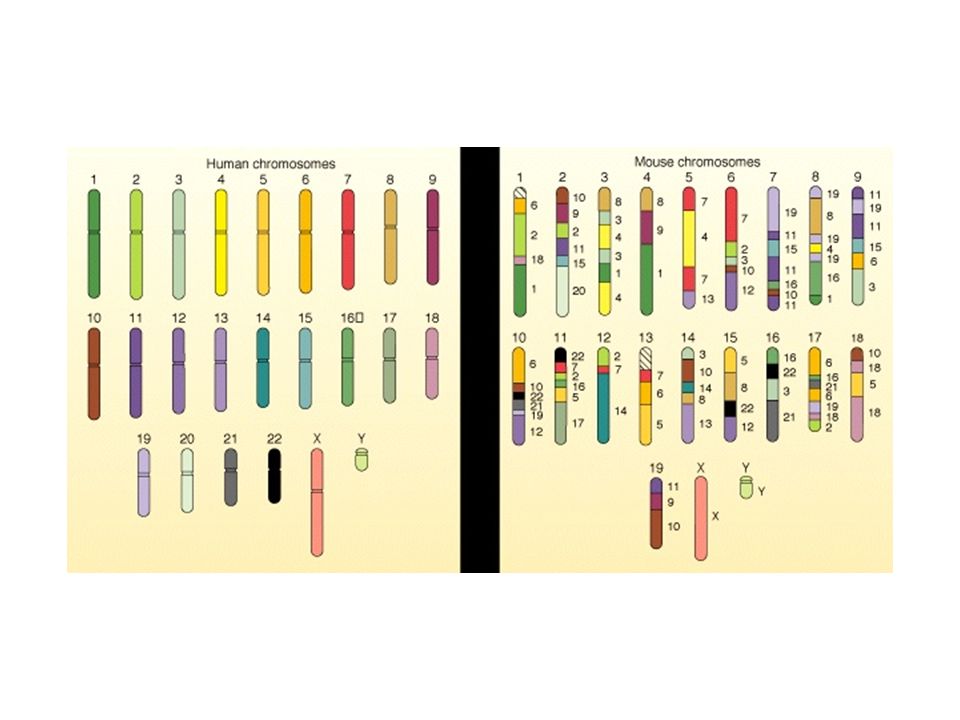
Low Resolution Physical Mapping Cytogenetic map In situ hybridization

12
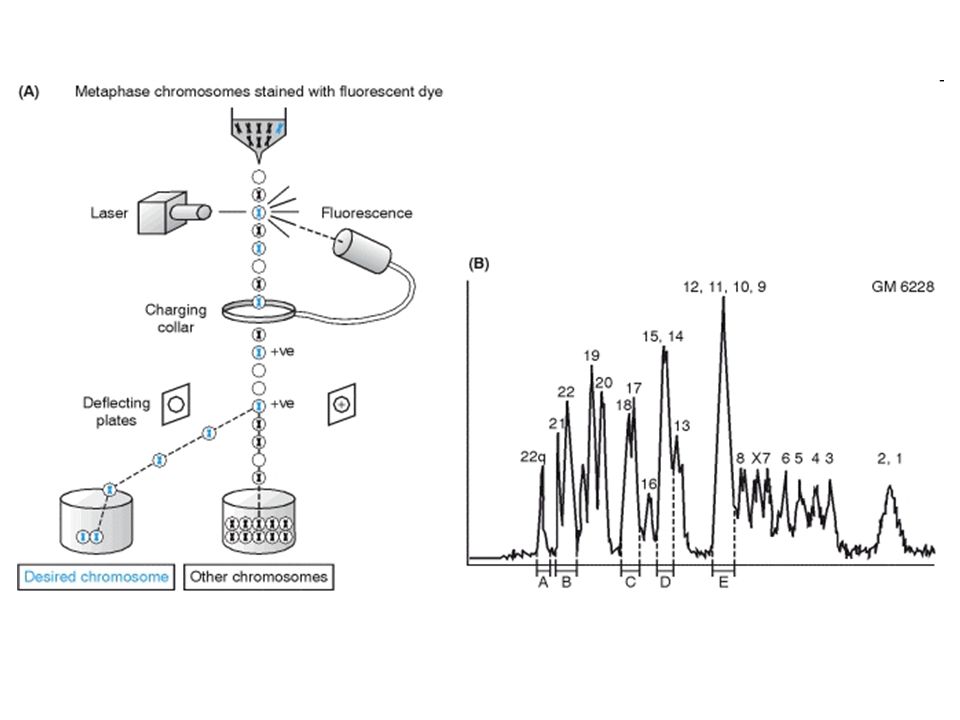
Chromosome Sorting Flow cytometry Used in library construction Also for chromosome paints

14
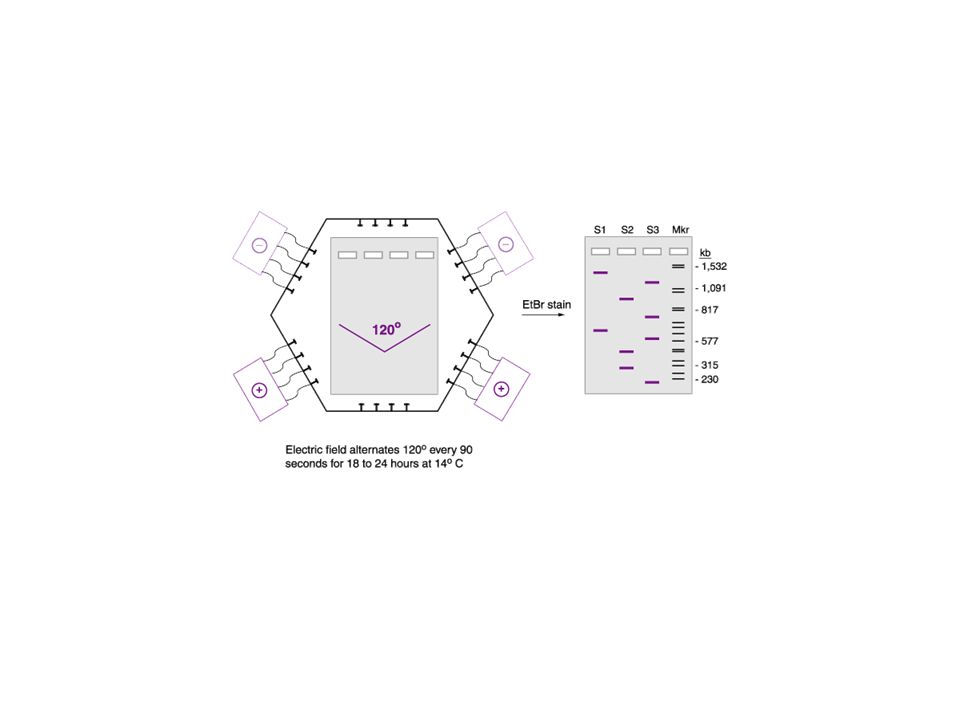
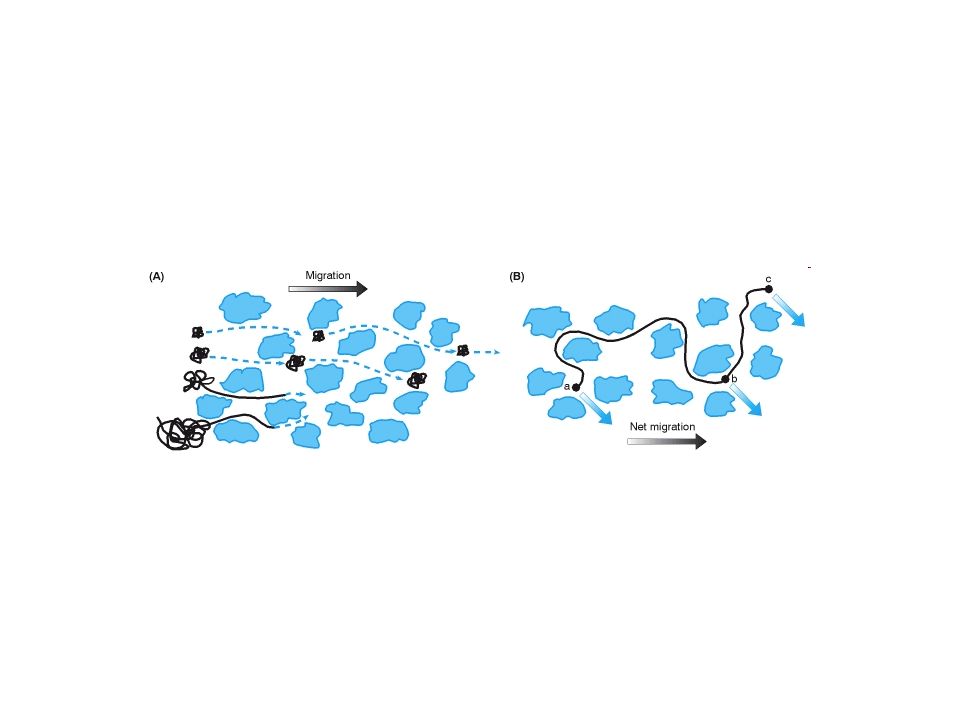
Pulsed Field Gel Electrophoresis

17
Polymerase Chain Reaction (PCR) Ability to generate identical high copy number DNAs made possible in the 1970s by recombinant DNA technology (i.e., cloning). Cloning DNA is time consuming and expensive (>>$15/sample). Probing libraries can be like hunting for a needle in a haystack. PCR, “discovered” in 1983 by Kary Mullis, enables the amplification (or duplication) of millions of copies of any DNA sequence with known flanking sequences. Requires only simple, inexpensive ingredients and a couple hours. DNA template Primers (anneal to flanking sequences) DNA polymerase dNTPs Mg 2+ Buffer Can be performed by hand or in a machine called a thermal cycler. 1993: Nobel Prize for Chemistry
. Probing libraries can be like hunting for a needle in a haystack. PCR, discovered in 1983 by Kary Mullis, enables the amplification (or duplication) of millions of copies of any DNA sequence with known flanking sequences. Requires only simple, inexpensive ingredients and a couple hours. DNA template Primers (anneal to flanking sequences) DNA polymerase dNTPs Mg 2+ Buffer Can be performed by hand or in a machine called a thermal cycler. 1993: Nobel Prize for Chemistry.")
18
Fig. 9.3 Denature Anneal PCR Primers Extend PCR Primers w/Taq Repeat…

19
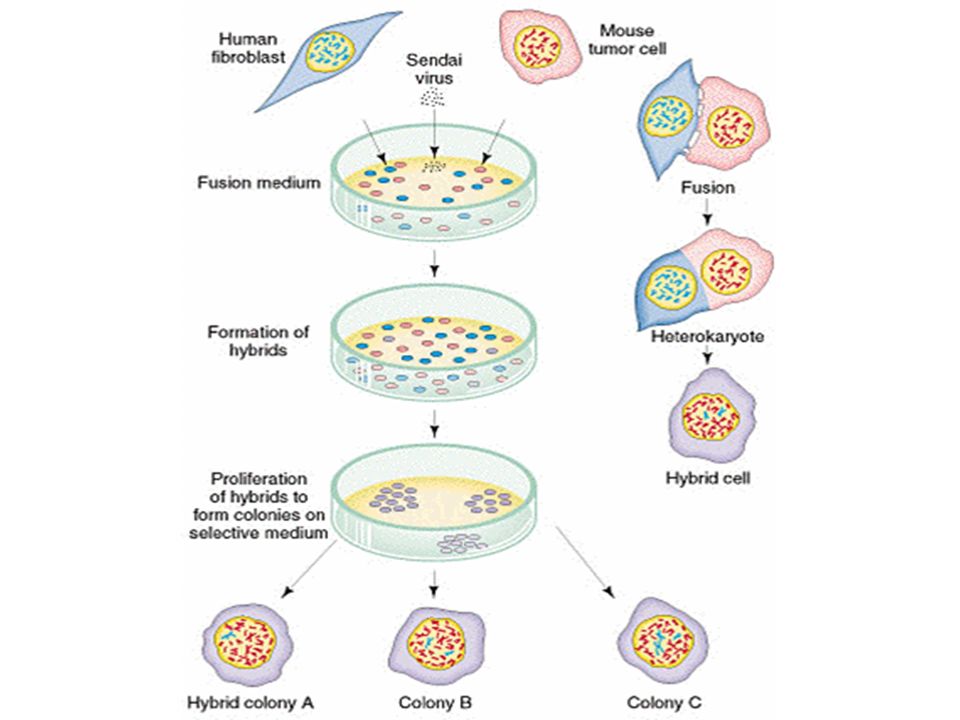
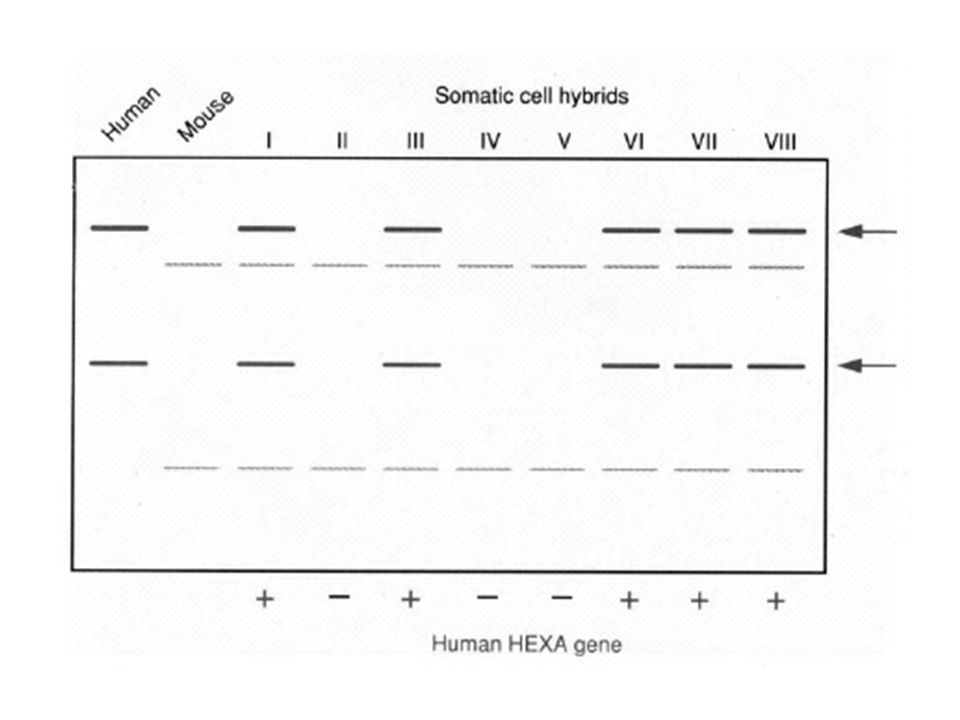
Somatic Cell Genetics in Mammals

23
Radiation Hybrid Mapping

25
Fluorescent Dye Dideoxy-sequencing

26
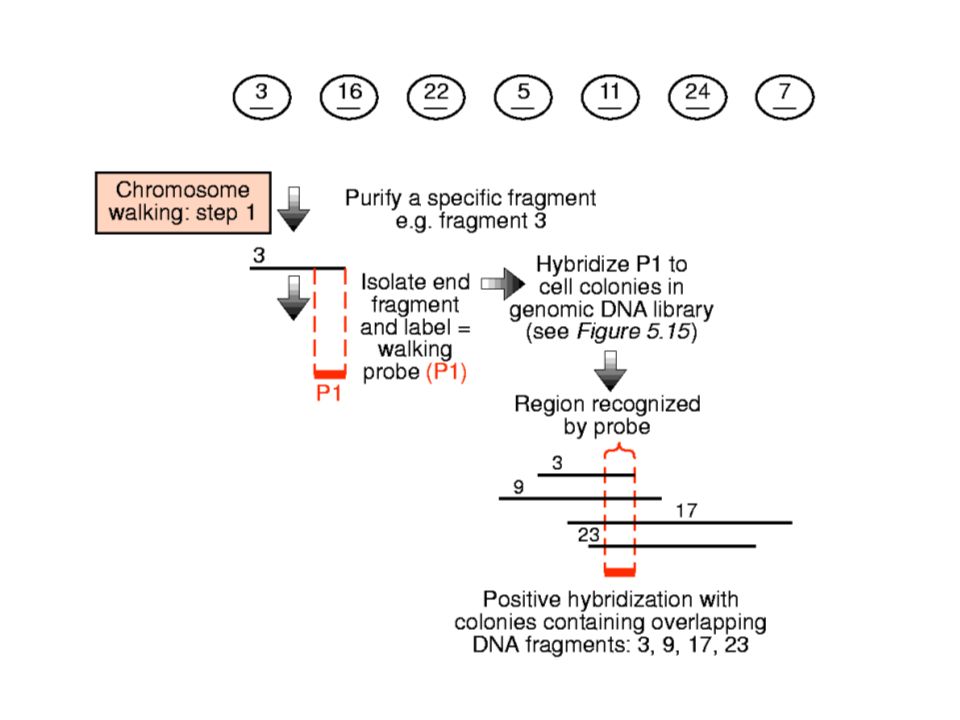
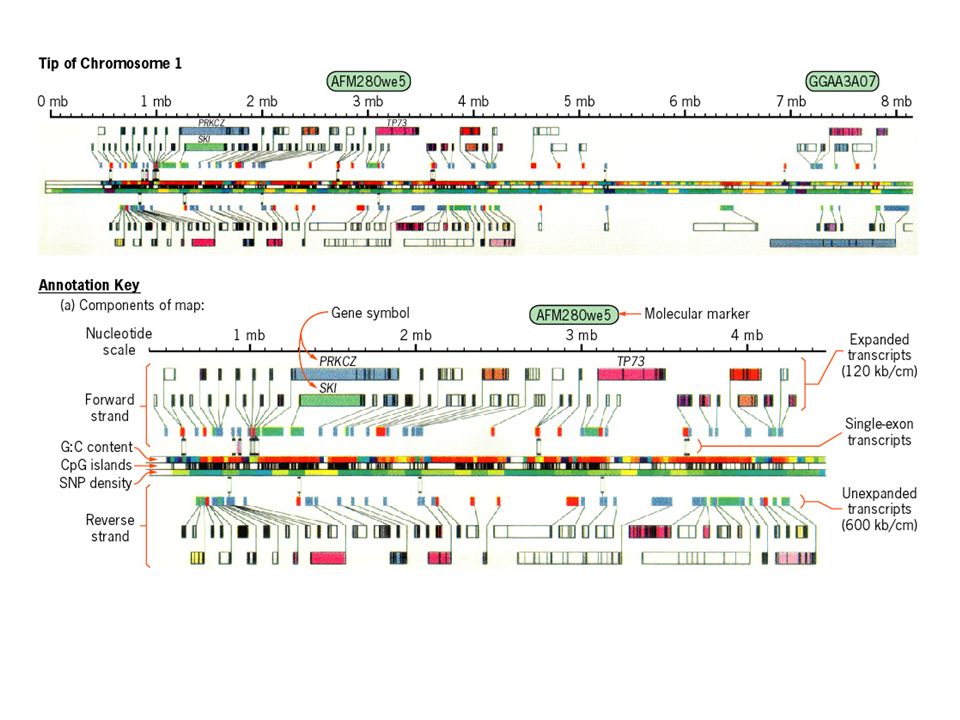
Top-down mapping

29
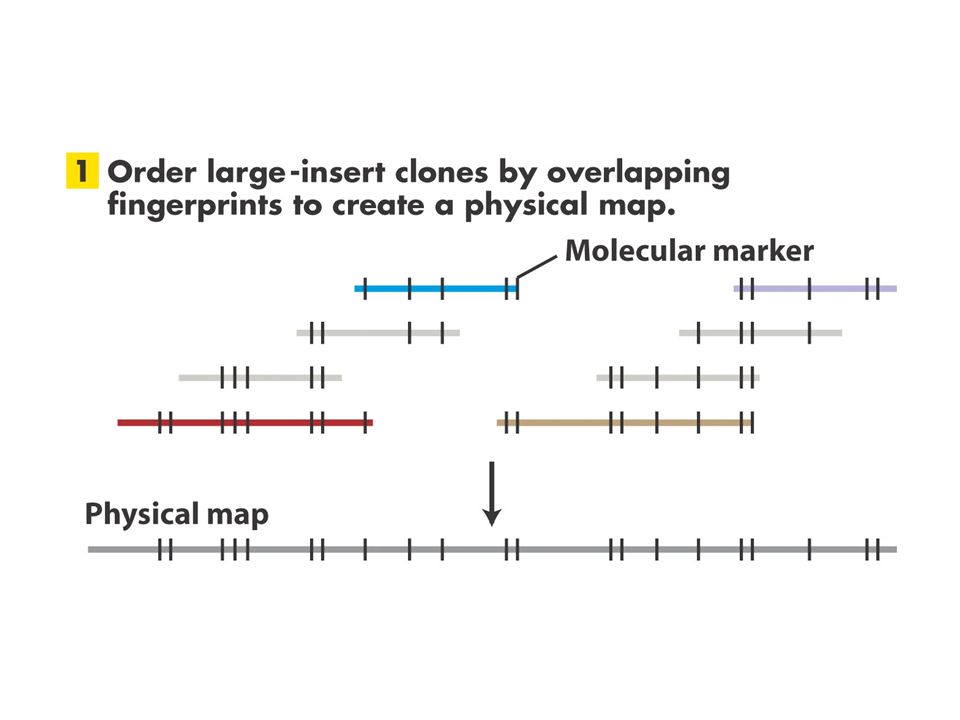
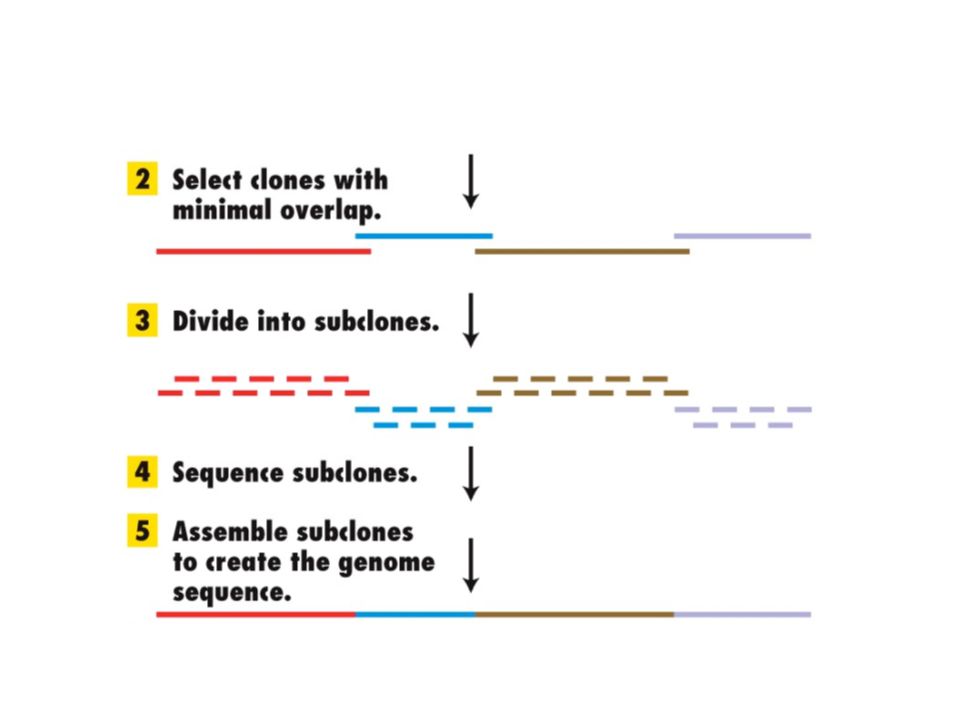
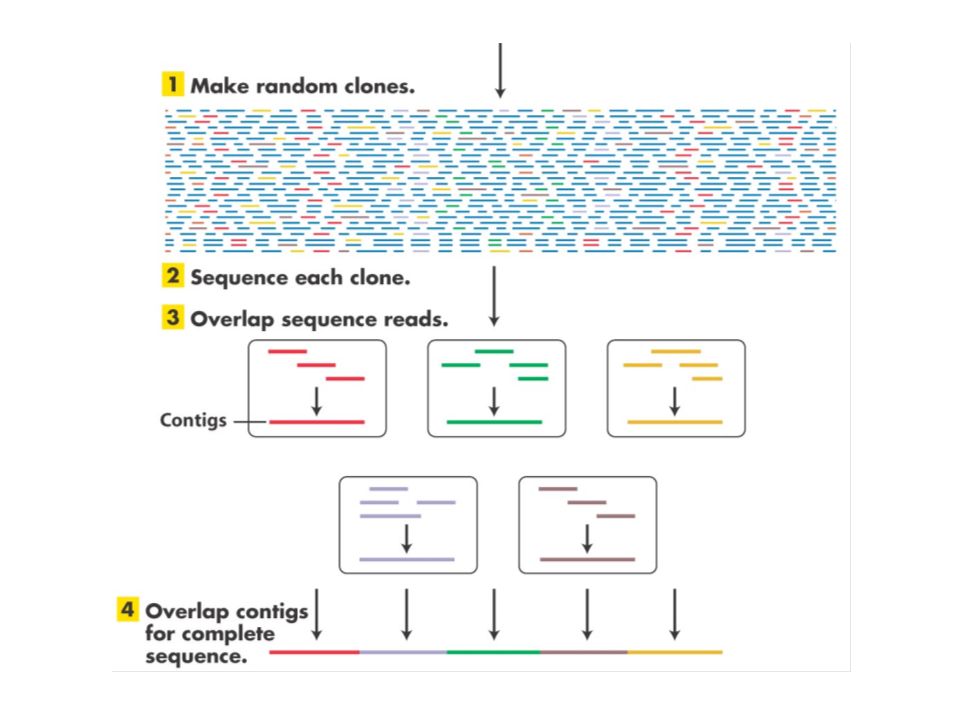
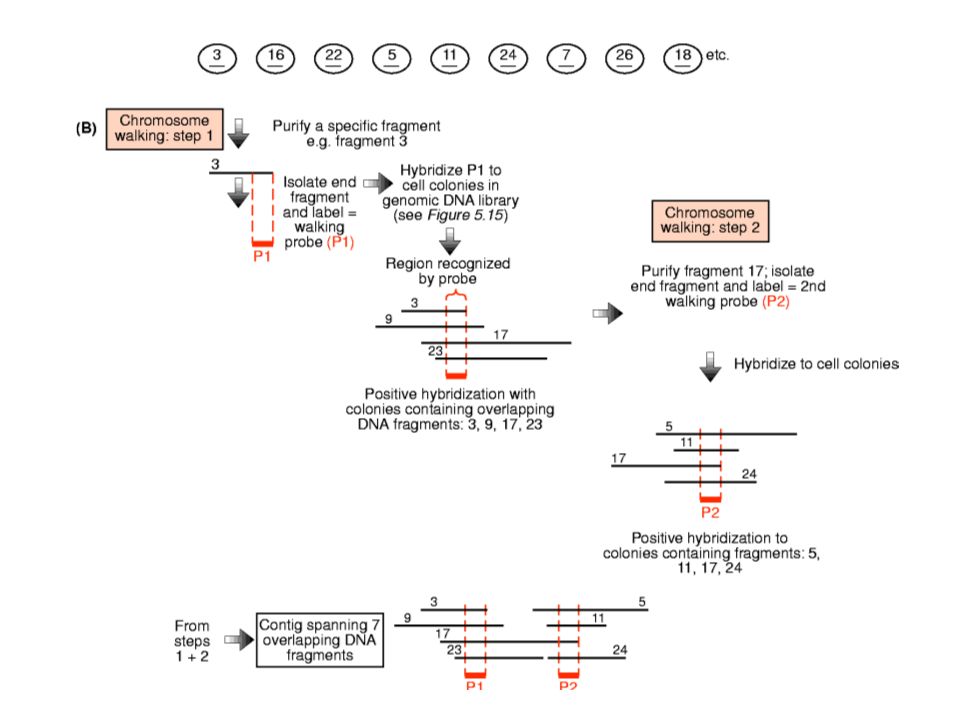
Bottom-up Mapping (Contig Maps, Mapping With Ordered Clones)
")
31
African-AmericanAsian-ChineseHispanic-MexicanCaucasian Whose genome did Celera sequence? Supposedly: Actually: Celera’s genome is Craig Venter’s Science v. 291, pp 1304-1351

32
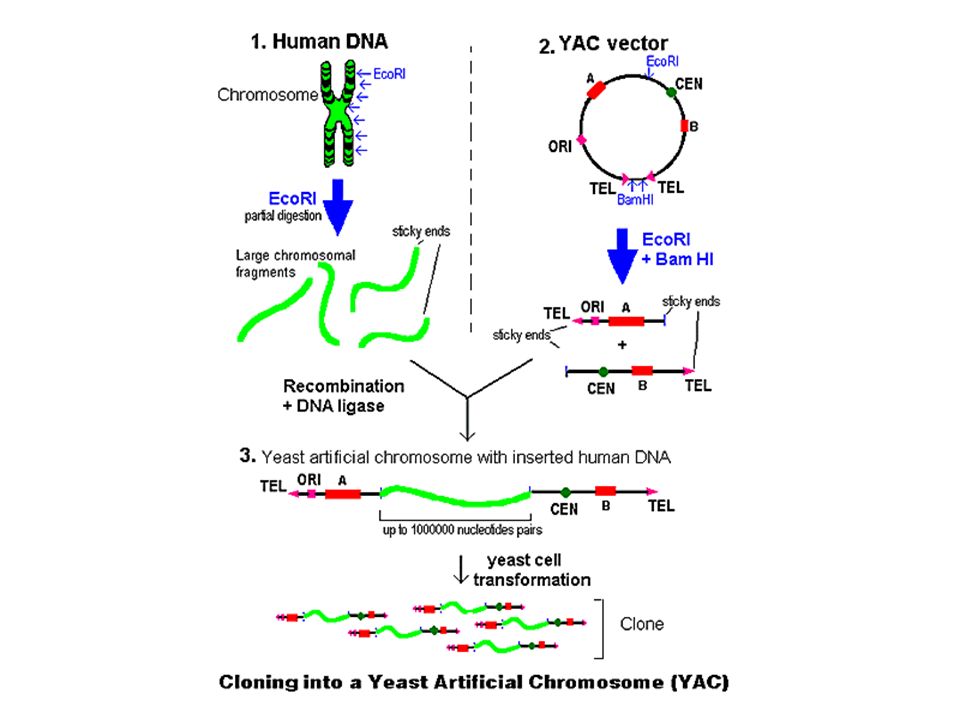
Cloning Vectors Plasmid Phagemid Cosmid, fosmid YACs BACs PACs

36
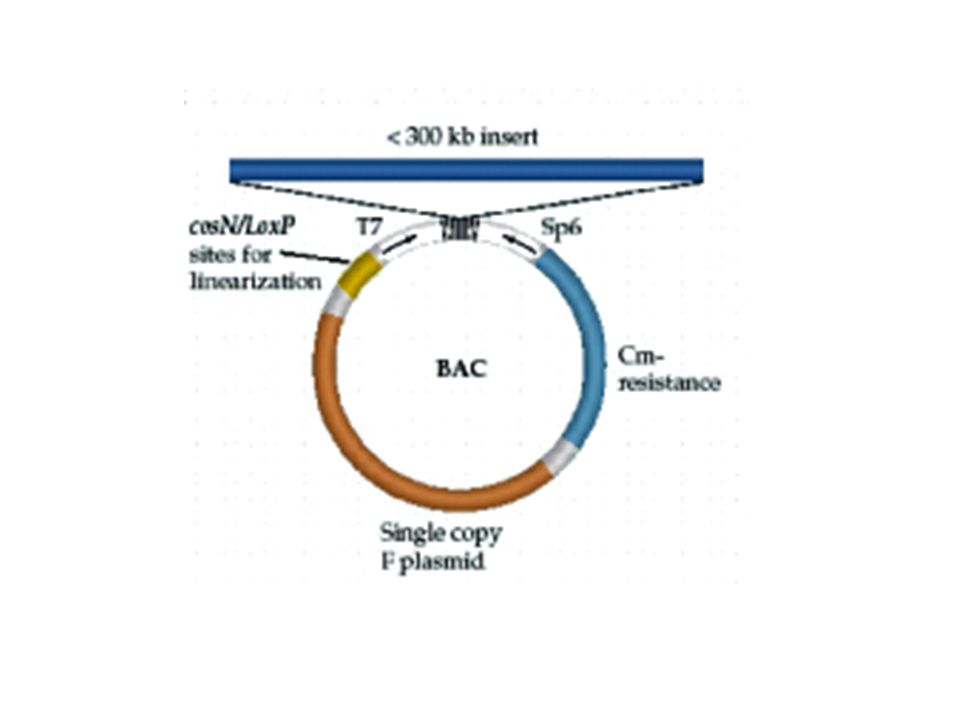
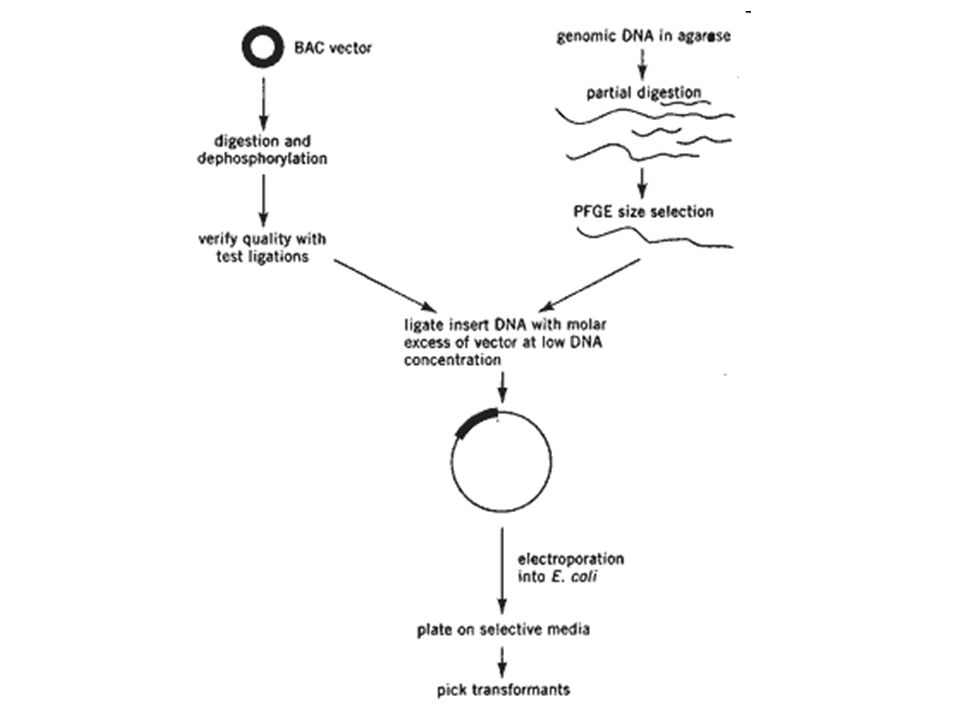
BAC Construction Scheme T7 Insert SP6 Insert size ; 50-300Kb ( mean 110kb) BAC vector (pIndigo 536)
 BAC vector (pIndigo 536)")
37
Application Of BAC library BAC library Whole genome sequencing Construction of integrated genetic and physical map Fine mapping for interest gene Chromosome walking & contig assembly Positional cloning Fluorescent in situ hybridization

40
“virtual autorad” - real-time DNA sequence output from ABI 377 1.Trace files (dye signals) are analyzed and bases called to create chromatograms. 2.Chromatograms from opposite strands are reconciled with software to create double- stranded sequence data.

41
Maximum pyrosequencing read lengths currently are 300-500 nt. Commercial applications: 454 Life Sciences Genome Sequencer FLX Generate 400 million nt in 10 hours $5-7K USD per run $1M for mammalian genome

45
Zoo Blot

47
CpG islands

48
Northern Blots

49
Real-time Quantitative PCR: Measures the abundance of DNA as it is amplified. Useful for quantitatively measuring the levels of mRNA in a sample. Uses reverse transcriptase to generate cDNA for the template. Can also be used to quantitatively estimate fraction of DNA from various organisms in a heterogenous sample (e.g, can be used to measure abundance of different microbes in soil sample). Fluorescent dye, SYBR Green, is incorporated into PCR reaction. SYBR Green fluoresces strongly when bound to DNA, but emits little fluorescence when not bound to DNA. SYBR Green fluorescence is proportional to the amount of DNA amplified, detected with a laser or other device. Experimental samples are compared to control sample with known concentration of cDNA.
. Fluorescent dye, SYBR Green, is incorporated into PCR reaction. SYBR Green fluoresces strongly when bound to DNA, but emits little fluorescence when not bound to DNA. SYBR Green fluorescence is proportional to the amount of DNA amplified, detected with a laser or other device. Experimental samples are compared to control sample with known concentration of cDNA..")
50
Fig. 10.9 SYBR Green binds to double-stranded DNA and fluoresces

51
Real-time Quantitative PCR amplification plot:

52
4h8h12h1d 15’30’1h2hNA4h8h12h1d 15’30’1h2hNA P. trifoliataC. paradisi PtCBF CORc115

53
Use trapped exons to identify candidate genes from cDNAs

54
Sequence Conservation Homology searches

55
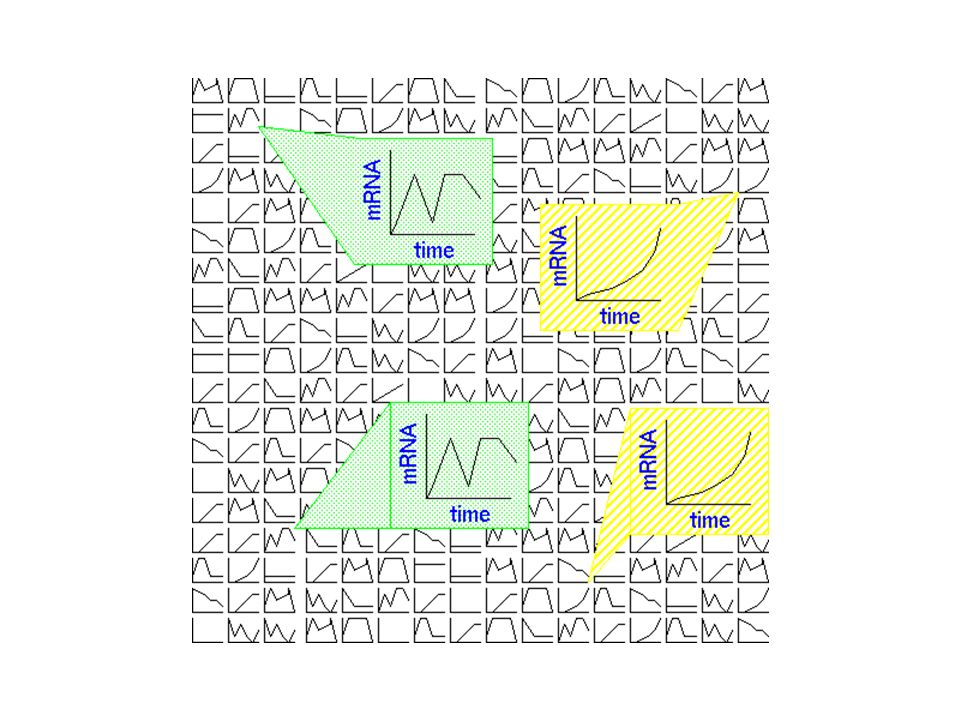
Array Technology

59
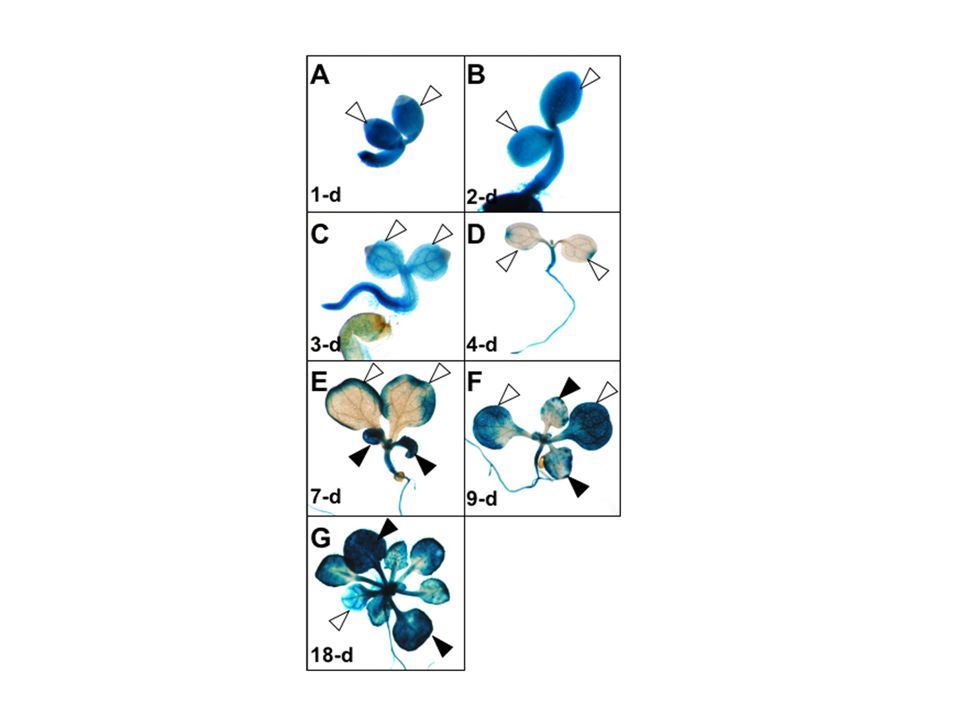
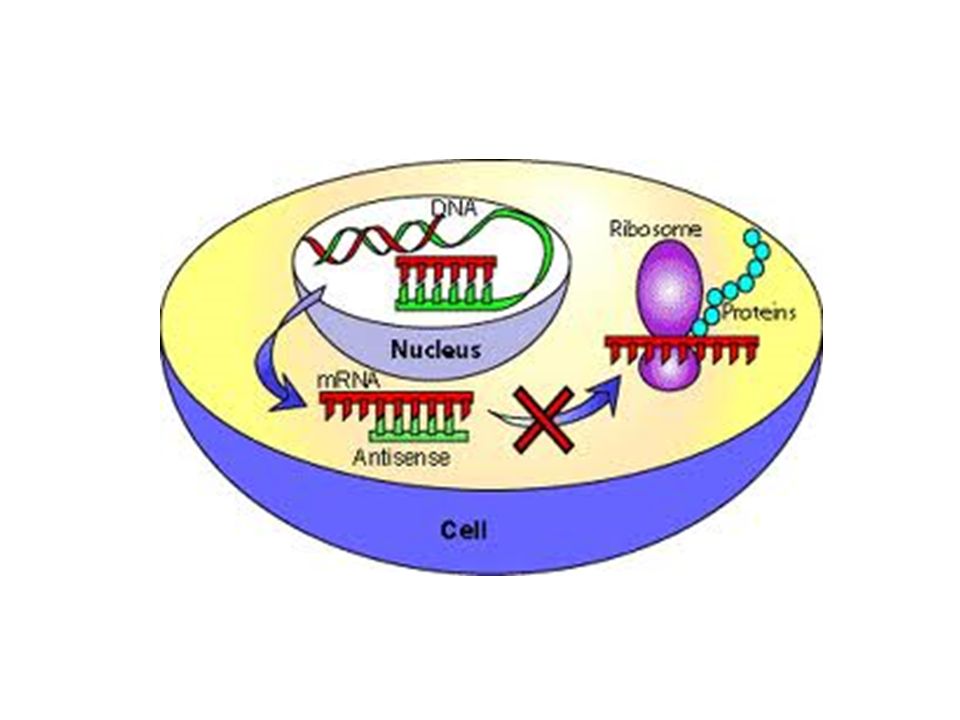
Gene Complementation Mutants Overexpression “Knockouts” RNAi Reporter assays

Similar presentations


 3. cycle sequencing 4. large scale sequencing stefanie.hartmann.>")


 Analysis of DNA (Sequencing) Chemical Synthesis.>")


 Isolate total RNA Isolate mRNA from total RNA (poly.>")
 Analysis of DNA (Sequencing) Chemical Synthesis of DNA.>")


 1.Polymerase Chain Reaction (PCR) 1.Standard PCR 2.Real-time quantitative PCR 2.DNA sequencing.>")


 FISH 2) “Restriction mapping” 3) Southern analysis : DNA 4) Northern analysis: RNA tells size tells which tissues or conditions.>")
 Size rangeExample speciesEx. Size BACTERIA1-10 Mb E. coli: 4.639 Mb FUNGI10-40 Mb S. cerevisiae 13 Mb INSECTS.>")