Download presentation
Presentation is loading. Please wait.

2
26 Investment, Saving, and the Real Interest Rate
CHAPTER Notes and teaching tips: 10, 28, 44, and 49. To view a full-screen figure during a class, click the red “expand” button. To return to the previous slide, click the red “shrink” button. To advance to the next slide, click anywhere on the full screen figure.

3
C H A P T E R C H E C K L I S T When you have completed your study of this chapter, you will be able to 1 Define and explain the relationships among capital, investment, wealth, and saving; and describe the markets for financial capital. 2 Explain how investment and saving decisions are made and how these decisions interact in the market for loanable funds to determine the real interest rate and the amount of investment and saving. 3 Explain how government influences the real interest rate, investment, and saving.

4
26.1 PHYSICAL CAPITAL AND FINANCIAL CAPITAL
Physical capital is the tools, instruments, machines, buildings, and other constructions that have been produced in the past and that are used to produce goods and services. Financial capital is the funds that firms use to buy and operate physical capital.

5
26.1 PHYSICAL CAPITAL AND FINANCIAL CAPITAL
Investment and Capital Gross investment is the total amount spent on new capital goods. Net investment is the change in the quantity of capital—equals gross investment minus depreciation.

6
26.1 PHYSICAL CAPITAL AND FINANCIAL CAPITAL
Figure 26.1 illustrates the relationship between capital and investment. On January 1, 2008,Tom’s DVD Burning, Inc. had DVD recording machines valued at $30,000.

7
26.1 PHYSICAL CAPITAL AND FINANCIAL …
During 2008, the value of Tom machines falls by $20,000, depreciation. He spent $30,000 on new machines—gross investment. Tom’s net investment was $10,000, so at the end of 2008,Tom had capital valued at $40,000.

9
26.1 PHYSICAL CAPITAL AND FINANCIAL CAPITAL
Wealth and Saving Wealth is the value of all the things that a person owns. Saving is the amount of income that is not paid in taxes or spent on consumption goods and services; saving adds to wealth.

10
26.1 PHYSICAL CAPITAL AND FINANCIAL CAPITAL
Markets for Financial Capital Saving is the source of funds that are used to finance investment, and these funds are supplied and demanded by four groups of markets: Stock markets Bond markets Short-term securities markets Loans markets This chapter presents a good chance to introduce how borrowers and savers are brought together and to emphasize the role of financial markets. Spend some time talking about stocks and bonds. Explain that these provide funds for a firm just like going to a bank. Describe that a firm could raise funds by borrowing from a bank, by issuing a bond (that students could buy), or by selling a stock (that students could buy). This will help students to see that saving by households (through putting funds in a bank, buying a stock, or buying a bond) all provide funds that firms can use to invest. Remember to highlight what investment means again (and always refer to students buying stocks and bonds as saving, not investment!). Indeed, students often are eager to talk about stocks. Your lecture will launch itself (or at least your students’ interests will be launched!) if you spend a little time introducing some basic concepts, even if you don’t intend to spend an entire lecture on the topic. You can ask your students to define a stock. Some will probably be able to respond that it represents partial ownership in a company but many, especially the younger ones, will be unaware of this basic fact. Stocks represent a claim to the profits that are made by a firm. This observation is where discussion has the potential for some interesting turning points. Some stocks trade at very high prices even when there are no earnings or else very little earnings. Currently, many biotech companies fit this description well. So what is going on here? Explain that when investors buy stocks in a company, the price they are willing to pay is based on expectations of profits that the company will earn in the future. Of course, sometimes these profits never materialize. Ask what happens to the price of these stocks when investor expectations are not met. Your students will have no trouble telling you that this will have a depressing effect on the price of these stocks.
, or by selling a stock (that students could buy). This will help students to see that saving by households (through putting funds in a bank, buying a stock, or buying a bond) all provide funds that firms can use to invest. Remember to highlight what investment means again (and always refer to students buying stocks and bonds as saving, not investment!). Indeed, students often are eager to talk about stocks. Your lecture will launch itself (or at least your students’ interests will be launched!) if you spend a little time introducing some basic concepts, even if you don’t intend to spend an entire lecture on the topic. You can ask your students to define a stock. Some will probably be able to respond that it represents partial ownership in a company but many, especially the younger ones, will be unaware of this basic fact. Stocks represent a claim to the profits that are made by a firm. This observation is where discussion has the potential for some interesting turning points. Some stocks trade at very high prices even when there are no earnings or else very little earnings. Currently, many biotech companies fit this description well. So what is going on here Explain that when investors buy stocks in a company, the price they are willing to pay is based on expectations of profits that the company will earn in the future. Of course, sometimes these profits never materialize. Ask what happens to the price of these stocks when investor expectations are not met. Your students will have no trouble telling you that this will have a depressing effect on the price of these stocks.")
11
26.1 PHYSICAL CAPITAL AND FINANCIAL CAPITAL
Stock Markets Stock is a certificate of ownership and claim to the profits that a firm makes. Stock market is a financial market in which shares of companies’ stocks are traded.

12
26.1 PHYSICAL CAPITAL AND FINANCIAL CAPITAL
Bond Markets Bond is a promise to pay specified sums of money on specified dates; it is a debt for the issuer. Bond market is a financial market in which bonds issued by firms and governments are traded.

13
26.1 PHYSICAL CAPITAL AND FINANCIAL CAPITAL
Short-Term Securities Markets Short-term securities are commercial bills and Treasury bills—promises by large firms and government to pay an agreed sum 90 days in the future. Loans Markets Banks and other financial institutions lower the cost of financing firms’ capital expenditures by accepting short-term deposits and making longer-term loans.

14
26.1 PHYSICAL CAPITAL AND FINANCIAL CAPITAL
Global Financial Markets Lending is risky. A loan might not be repaid. Or the price of a stock or bond might fall. The riskier the loan, other things being equal, the higher is the interest rate. For a given risk, lenders want to earn the highest possible real interest rate and they will look everywhere in the world to find the highest real interest rate. Borrowers want to pay the lowest possible real interest rate. So borrowers will look everywhere in the world to find the lowest real interest rate.

15
26.1 PHYSICAL CAPITAL AND FINANCIAL CAPITAL
Because lenders are free to seek the highest real interest rate and borrowers are free to seek the lowest real interest rate, financial markets form a single, integrated, global market. The aggregate of all the individual financial markets is called the market for loanable funds.

16
26.1 PHYSICAL CAPITAL AND FINANCIAL CAPITAL
Interest Rates and Asset Prices Stocks, bonds, short-term securities, and loans are collectively called financial assets. The interest rate on a financial asset is a percentage of the price of the asset. So if the asset price rises, other things remaining the same, the interest rate falls. And conversely, if the asset price falls, other things remaining the same, the interest rate rises.

17
26.2 THE MARKET FOR LOANABLE FUNDS
Flows in the Market for Loanable Funds Loanable funds are used for 1. Business investment 2. Government budget deficit 3. International investment or lending Loanable funds come from 1. Private saving 2. Government budget surplus 3. International borrowing

18
26.2 THE MARKET FOR LOANABLE FUNDS
The Demand for Loanable Funds The quantity of loanable funds demanded depends on 1. The real interest rate 2. The expected profit The real interest rate is the opportunity cost of the funds used to finance the purchase of capital. So firms compare the real interest rate with the rate of profit that they expect to earn on their new capital.

19
26.2 THE MARKET FOR LOANABLE FUNDS
Firms invest only when they expect to earn a rate of profit that exceeds the real interest rate. The higher the real interest rate, the fewer projects that are profitable, so the smaller is the quantity of loanable funds demanded. The lower the real interest rate, the more projects that are profitable, so the larger is the quantity of loanable funds demanded.

20
26.2 THE MARKET FOR LOANABLE FUNDS
Demand for Loanable Funds Curve The demand for loanable funds curve is the relationship between the quantity of investment demanded and the real interest rate, other things remaining the same. The demand for loanable funds is shown by an demand for loanable funds schedule or curve.

21
26.2 THE MARKET FOR LOANABLE FUNDS
Figure 26.2 shows the demand for loanable funds. The table and figure show the quantity of loanable funds demanded at five real interest rates. Points A through E on the curve DLF correspond to the rows in the table.

22
26.2 THE MARKET FOR LOANABLE FUNDS
1. A rise in the real interest rate decreases the quantity of loanable funds demanded. 2. A fall in the real interest rate increases the quantity of loanable funds demanded.

24
26.2 THE MARKET FOR LOANABLE FUNDS
Changes in the Demand for Loanable Funds When the expected profit changes, the demand for loanable funds changes. Other things remaining the same, the greater the expected profit from new capital, the greater is the amount of investment and the greater is the demand of loanable funds .

25
26.2 THE MARKET FOR LOANABLE FUNDS
The many influences on expected profit can be placed in three groups: Objective influences such as the phase of the business cycle, technological change, and population growth Subjective influences summarized in the phrase “animal spirits” Contagion effects summarized in the phrase “irrational exuberance”

26
26.2 THE MARKET FOR LOANABLE FUNDS
Figure 26.3 shows : 1. An increase in expected profit increases investment and shifts the demand for loanable funds curve rightward to DLF1. 2. A decrease in expected profit decreases investment and shifts the demand for loanable funds curve leftward to DLF2.

28
26.2 THE MARKET FOR LOANABLE FUNDS
Supply of Loanable Funds The quantity of loanable funds supplied is the total funds available from private saving, the government budget surplus, and international borrowing during a given period. Saving is the main item and it depends on 1. The real interest rate 2. Disposable income 3. Wealth 4. Expected future income The discussion of what determines saving behavior can be used to talk about social security benefits. Students usually have an idea of Social Security but don’t often understand what it is or how it works. Use this chance to explain defined‐benefit versus defined‐contribution plans. Many students will mention that social security benefits might not be available when they retire. Ask them how they might respond to the uncertainty in the availability of future benefits. At least some students will mention saving more in different forms. Spend a little time explaining some of these (such as IRAs or 401k plans). Reiterate that individuals make decisions based on expectations of future income and expectations of future needs for income.
. Reiterate that individuals make decisions based on expectations of future income and expectations of future needs for income.")
29
26.2 THE MARKET FOR LOANABLE FUNDS
Other things remaining the same, The higher the real interest rate, the greater is the quantity of saving and the greater is the quantity of loanable funds supplied. The lower the real interest rate, the smaller is the quantity of saving and the smaller is the quantity of loanable funds supplied.

30
26.2 THE MARKET FOR LOANABLE FUNDS
The Supply of Loanable Funds Curve The supply of loanable funds is the relationship between the quantity of loanable funds supplied and the real interest rate when all other influences on lending plans remain the same. The real interest rate is the opportunity cost of consumption expenditure. A dollar spent is a dollar not saved, so the interest that could have been earned on that saving is forgone.

31
26.2 THE MARKET FOR LOANABLE FUNDS
Figure 26.4 shows supply of loanable funds. The table and figure show the quantity of loanable funds supplied at five real interest rates. Points A through E on the curve correspond to the rows in the table.

32
26.2 THE MARKET FOR LOANABLE FUNDS
1. A rise in the real interest rate increases the quantity of loanable funds supplied. 2. A fall in the real interest rate decreases the quantity of loanable funds supplied.

34
26.2 THE MARKET FOR LOANABLE FUNDS
Changes in Supply of Loanable Funds The three main factors that influence saving and change the supply of loanable funds are 1. Disposable income 2. Wealth 3. Expected future income

35
26.2 THE MARKET FOR LOANABLE FUNDS
Disposable income is the income earned minus net taxes. Other things remaining the same, The greater a household’s disposable income, the greater is its saving. The greater a household’s wealth (what it owns), the less it will save. The higher a household’s expected future income, the smaller is its saving today.
, the less it will save. The higher a household’s expected future income, the smaller is its saving today.")
36
26.2 THE MARKET FOR LOANABLE FUNDS
Shifts of the Supply of Loanable Funds Curve Along the supply of loanable funds curve, all the influences on saving other than the real interest rate remain the same. A change in any of these influences on saving changes saving and shifts the supply of loanable funds curve.

37
26.2 THE MARKET FOR LOANABLE FUNDS
Figure 26.5 shows a change in the supply of loanable funds. 1. The supply of loanable funds curve shifts rightward from SLF0 to SLF1 if Disposable income increases Wealth decreases Expected future income decreases

38
26.2 THE MARKET FOR LOANABLE FUNDS
2. The supply of loanable funds curve shifts leftward from SLF0 to SLF2 if Disposable income decreases Wealth increases Expected future income increases

40
26.2 THE MARKET FOR LOANABLE FUNDS
Equilibrium in the Market for Loanable Funds Figure 26.6 shows how the real interest rate is determined. DLF is the demand for loanable funds curve SLF is the supply of loanable funds curve

41
26.2 THE MARKET FOR LOANABLE FUNDS
1. If the real interest rate is 8 percent a year, the quantity demanded is less than the quantity supplied. There is a surplus of funds. The real interest rate falls. 2. If the real interest rate is 4 percent a year, the quantity demanded exceeds the quantity supplied. There is a shortage of funds. The real interest rate rises.

42
26.2 THE MARKET FOR LOANABLE FUNDS
3. When the real interest rate is 6 percent a year, the quantity of loanable funds demanded equals the quantity supplied. There is neither a shortage nor a surplus of funds, and the real interest rate is at its equilibrium level.

44
26.2 THE MARKET FOR LOANABLE FUNDS
Changes in Demand and Supply 1. If the demand for loanable funds increases, the real interest rate rises. 2. If the supply of loanable funds increases, the real interest rate falls. Students usually have many questions about the role of the government and the potential dangers of high budget deficits that they may have heard about on the news or in discussions at home. You might take this opportunity to discuss budget deficits in greater detail. Use the material on the Ricardo-Barro effect versus crowding out to highlight some of the controversy in the politics of budget deficits. Students can then see how the application of economic models may still lead individuals to different conclusions. You may wish to tie this to current political discussions regarding budget deficits (and specific funding requests by the government) and the effects on the economy.
 and the effects on the economy.")
46
26.3 GOVERNMENT IN LOANABLE FUNDS MARKET
Government Budget and Government Saving GDP is the sum of consumption expenditure C, investment I, government expenditure G, and net exports NX. In the global economy, net exports are zero, so for the world as a whole: Y = C + I + G. GDP equals total income, which is the sum of consumption expenditure C, saving S, and net taxes NT. That is, Y = C + S + NT.

47
26.3 GOVERNMENT IN LOANABLE FUNDS MARKET
Y = C + I + G Y = C + S + NT By combining these two equations: C + I + G = C + S + NT Subtract C and simplify the equation to I + G = S + NT Now subtract G from both sides of this equation to obtain I = S + (NT – G)
")
48
26.3 GOVERNMENT IN LOANABLE FUNDS MARKET
I = S + (NT – G) This equation tells us that investment is financed by private saving S and government saving (NT – G). Government saving (NT – G) is also the government budget surplus.
 This equation tells us that investment is financed by private saving S and government saving (NT – G). Government saving (NT – G) is also the government budget surplus.")
49
26.3 GOVERNMENT IN LOANABLE FUNDS MARKET
Total saving equals private saving plus government saving. So when the government has a budget surplus, it contributes toward financing investment. But when the government has a budget deficit, it competes with businesses for private saving and decreases the amount available for investment. A comparison of the private saving rate to the public saving rate for the United States makes for an interesting discussion. You can compare these numbers to saving rates in other countries to provide a reference for the low saving rate in the United States. For example, see web exercise 16 for data on saving rates in the United States and some East Asian economies or for household saving rates in OECD countries go to You can also have students try to find these numbers – suggest they look specifically for private saving rates or private saving relative to disposable income. Caution them that they may have to search a bit because a general web search will bring up many bank websites with rates for saving accounts. Use these numbers to lead into a discussion of where the United States gets the funds that it uses for investment if U.S. households are not saving much. You probably do not want to go into too much detail here because the students have not yet studied international finance, but it is easy enough to mention that the United States currently borrows funds from abroad.

50
26.3 GOVERNMENT IN LOANABLE FUNDS MARKET
Effect of Government Saving A government budget surplus increases the supply of loanable funds. To find the supply of loanable funds, we must add the government budget surplus to private saving supply. An increase in the supply of loanable funds brings a lower real interest rate, which decreases the quantity of private funds supplied and increases the quantity of investment and the quantity of loanable funds demanded.

51
26.3 GOVERNMENT IN LOANABLE FUNDS MARKET
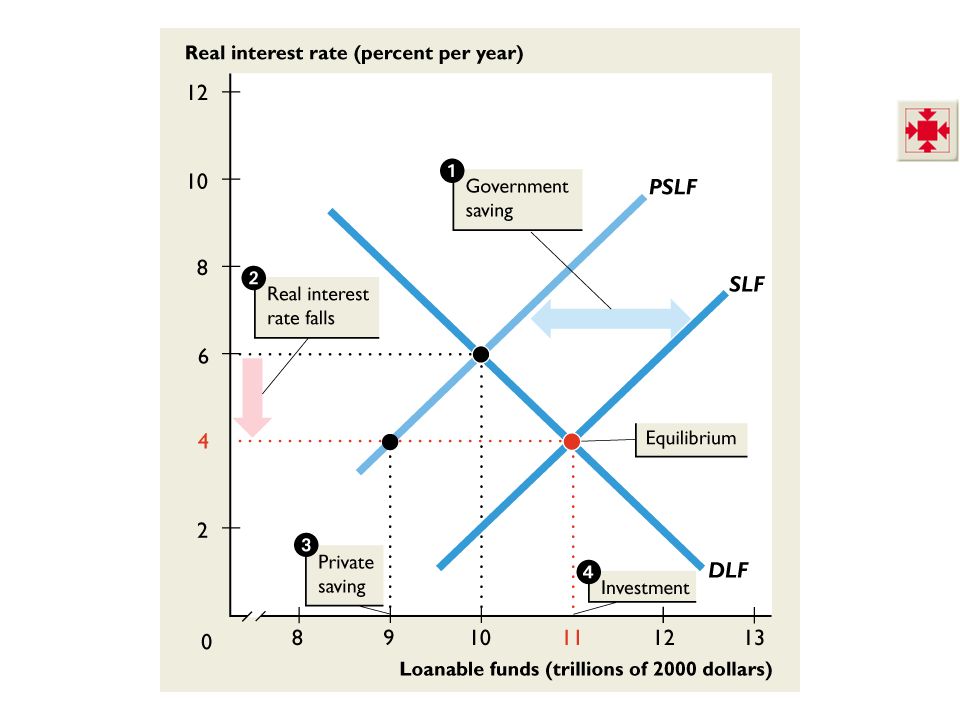
Figure 26.8 shows the effects of government saving. With balanced government budgets, the real interest rate is 6 percent a year and the quantity of loanable funds is $10 trillion a year. 1. A government budget surplus of $2 trillion is added to private saving to determine the supply of loanable funds curve SLF.

52
26.3 GOVERNMENT IN LOANABLE FUNDS MARKET
2. The real interest rate falls to 4 percent a year. 3. The private supply of funds decreases to $9 trillion. 4. The quantity of loanable funds demanded and investment increase to $11 trillion.

54
26.3 GOVERNMENT IN LOANABLE FUNDS MARKET
Government Deficit and Crowding Out A government budget deficit works in the opposite way to the surplus. The total supply of loanable funds equals private saving minus the government budget deficit. But a decrease in the supply of loanable funds raises the real interest rate, which increases the quantity of private funds supplied. What happens to investment?

55
26.3 GOVERNMENT IN LOANABLE FUNDS MARKET
The tendency for a government budget deficit to raise the real interest rate and decrease investment is called the crowding-out effect.

56
26.3 GOVERNMENT IN LOANABLE FUNDS MARKET
Figure 26.8 shows a crowding-out effect. With balanced government budgets, the real interest rate is 6 percent a year and the quantity of loanable funds is $10 trillion a year. Private saving and investment are 10 trillion a year.

57
26.3 GOVERNMENT IN LOANABLE FUNDS MARKET
1. A government budget deficit is subtracted from private saving to determine the total supply of loanable funds curve SLF.

58
26.3 GOVERNMENT IN LOANABLE FUNDS MARKET
2. The real interest rate rises to 8 percent a year. 3. Private saving increases to $11 trillion. 4. Total saving and investment decrease to $9 trillion. Investment is crowded out.

60
26.3 GOVERNMENT IN LOANABLE FUNDS MARKET
The Ricardo-Barro Effect The proposition that a government budget deficit has no effect on the real interest rate or investment. The Ricardo-Barro effect operates if private saving and the private supply of loanable funds increase to offset any government budget deficit so that the total supply of loanable funds is unchanged when the government has a budget deficit. Most economists regard this outcome unlikely.

61
APPENDIX: PRESENT VALUE
Present value is the present value of a future sum of money is the amount that will earn enough interest to grow to that future sum. We calculate a present value by using a process called discounting. The easiest way to understand discounting is to begin with opposite, compounding—converting a present sum to a future sum by earning interest.

62
APPENDIX: PRESENT VALUE
Compounding and Future Value A future sum of money is equal to the present sum (present value) plus the interest which will accumulate in the future. Suppose you put $100 in a savings account that earns an interest rate of 10 percent a year. After 1 year, you will have $110 in the bank. After 2 years, you will have $110 plus 10 percent interest on $110, which is $121.
 plus the interest which will accumulate in the future. Suppose you put $100 in a savings account that earns an interest rate of 10 percent a year. After 1 year, you will have $110 in the bank. After 2 years, you will have $110 plus 10 percent interest on $110, which is $121.")
63
APPENDIX: PRESENT VALUE
Future Value Formula When the interest rate is 10 percent a year (r = 0.1), $100 will accumulate as follows: After 1 year: $100 (1 + r) = $100 1.1 = $110. After 2 years: $100 (1 + r)2 = $100 1.21 = $121. After N years: $100 (1 + r)N
, $100 will accumulate as follows: After 1 year: $100 (1 + r) = $100 1.1 = $110. After 2 years: $100 (1 + r)2 = $100 1.21 = $121. After N years: $100 (1 + r)N.")
64
APPENDIX: PRESENT VALUE
Discounting and Present Value If the interest rate is 10 percent a year (r = 0.1) and you can have either $110 one year in the future or a different amount today, what is the amount you’d accept? You’d accept the present value of $110. The present value of $110 is the amount if invested today at an interest rate of 10 percent a year will grow to $110 after one year.
 and you can have either $110 one year in the future or a different amount today, what is the amount you’d accept You’d accept the present value of $110. The present value of $110 is the amount if invested today at an interest rate of 10 percent a year will grow to $110 after one year.")
65
APPENDIX: PRESENT VALUE
$110 = (Present value of $110) ( ) So Present value of $110 = $110 ( ) = $100. Present Value Formula To calculate the present value of a future sum: Present value = Sum 1 year later (1 + r). Present value = Sum 2 years later (1 + r)2. Present value = Sum N years later (1 + r)2.
 ( ) So. Present value of $110 = $110 ( ) = $100. Present Value Formula. To calculate the present value of a future sum: Present value = Sum 1 year later (1 + r). Present value = Sum 2 years later (1 + r)2. Present value = Sum N years later (1 + r)2.")
66
APPENDIX: PRESENT VALUE
The Crucial Roles of Time and the Interest Rate The present value of a future sum depends on How far in the future the money will be received The interest rate Shifting the time farther into the future lowers the present value. Raising the interest rate lowers the present value. Many decisions you make turn on present value, such as whether to pay off your credit card balance.

Similar presentations