Download presentation
Presentation is loading. Please wait.

1
Intro to Regression POL 242

2
Summary Regression is the process by which we fit a line to depict the relationship between two variables (usually both interval or close to it). This line allows us to predict a value of the dependent variable at each level of the independent variable. And the predicted change in the DV for a one-unit change in the IV. There is only one line that minimizes the distance between the actual, observed values of the independent value and the predicted values of the independent variable. The equation of a line is written with a slope and a y-intercept. For regression, the slope is the [unstandardized] coefficient and the y-intercept is called the constant.

5
Residuals The vertical distance between each point and the line represents the magnitude of an error in prediction. Observed (or Real) Value = Y Predicted Value = Y' The difference between the real and the predicted value is called the residual. The residual is the error in the prediction = Y - Y' To draw the best line, we want to minimize this error (shorten the distance between Y and Y') for all observations.
 Value = Y Predicted Value = Y The difference between the real and the predicted value is called the residual. The residual is the error in the prediction = Y - Y To draw the best line, we want to minimize this error (shorten the distance between Y and Y ) for all observations..")
6
Residuals Squared However, we cannot simply take the sum of the differences because some predicted Y' values will be greater than observed Y values (those points that fall below the line) and some Y' will be less than Y (illustrated with points above the line). To keep these negative and positive numbers from canceling each other out, we square the difference between the observed value and the predicted value = (Y-Y') 2 There is only one line that will minimize Σ(Y-Y') 2
 2 There is only one line that will minimize Σ(Y-Y ) 2.")
7
Equation of the regression line The equation of the line that predicts Y for values of X is: Y' = by X + αy Y' = predicted or estimated value of Y by = slope of the line for minimizing errors in predicting Y. This is the unstandardized coefficent. It represents how much Y is predicted to change for every one unit change in X. αy = Y axis intercept for minimizing errors in predicting Y. This is the constant. X = the [observed] value of X

8
Slope How to calculate the slope: Where SSx = sum of the squares of X = N = number of paired observations.

9
The constant How to calculate the Y- axis intercept: A bar above the variable letter means that it is an average. For example:

10
Three Examples Study hard, get good grades? http://www.dynamicgeometry.com/JavaSketc hpad/Gallery/Other_Explorations_and_Amus ements/Least_Squares.html http://www.dynamicgeometry.com/JavaSketc hpad/Gallery/Other_Explorations_and_Amus ements/Least_Squares.html http://standards.nctm.org/document/eexampl es/chap7/7.4/ http://standards.nctm.org/document/eexampl es/chap7/7.4/

11
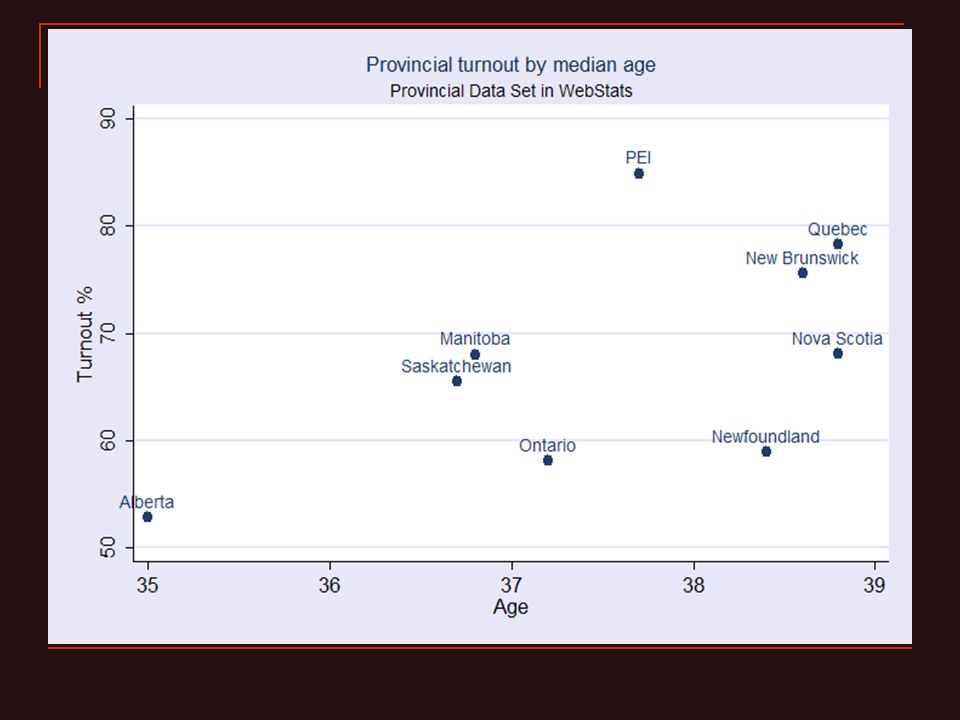
------------------ Variables in the Equation ------------------ Variable B SE B Beta T Sig T AGE 4.668449 2.550202.568988 1.831.1098 (Constant) -107.526203 95.822840 -1.122.2988 Webstats Output Y-intercept Predicted change in Y for every one unit change in X (Slope)
 Webstats Output Y-intercept Predicted change in Y for every one unit change in X (Slope)")
Similar presentations