Download presentation
Presentation is loading. Please wait.

1
Assessment of SBUV Profile Algorithm Using High Vertical Resolution Sensors Assessment of SBUV Profile Algorithm Using High Vertical Resolution Sensors R. McPeters, P.K. Bhartia, S. Frith, and G. Labow NASA Goddard Space Flight Center CEOS ACC-11 Frascati, Italy April 28, 2015

2
SBUV data from a series of 9 instruments reprocessed with coherent calibration – version 8.6

3
SBUV retrieval layer structure (20 layers) ( much finer than actual resolution )
 ( much finer than actual resolution )")
4
Compare with MLS Agreement usually within ±5% at all altitudes and seasons.

5
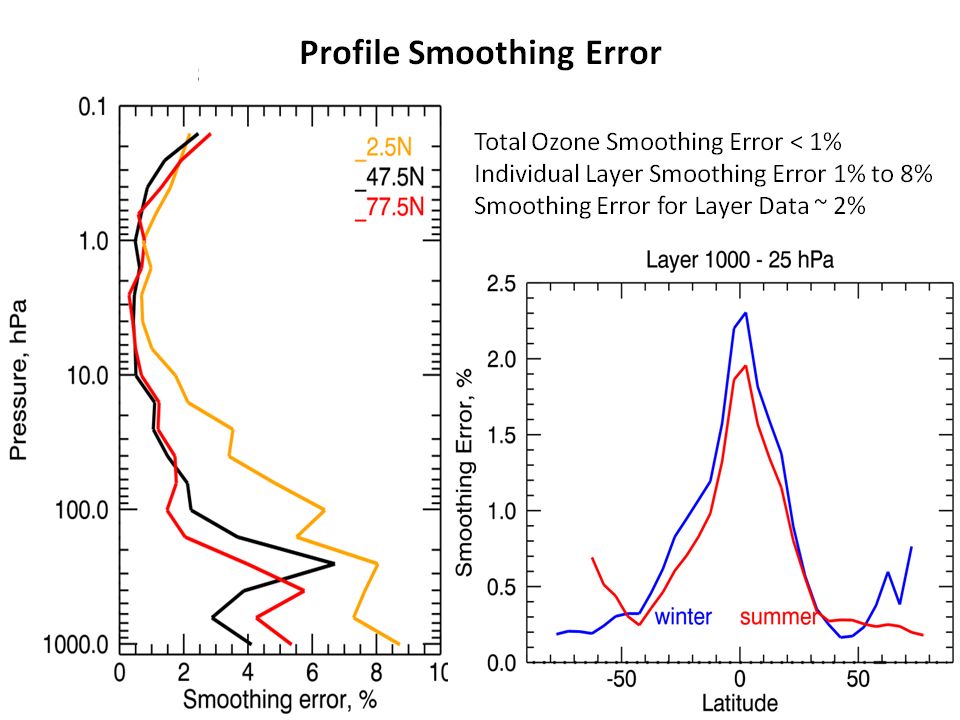
Compare with MLS SBUV Smoothing error - Quasi-Biennial Oscillation

6
Typical SBUV Averaging Kernels for (a) the tropics and (b) northern middle latitudes. Different colors correspond to individual layers, (layer numbers are indicated on the right).
..")
7
SBUV averaging kernel applied to MLS produces similar QBO pattern

8
In upper stratosphere averaging kernel not needed

9
Agreement with MLS is good in the upper stratosphere

10
Large differences due to smoothing error below 16 hPa

11
LP in DU/layer LP in DU/layer convolved with SBUV AK SBUV in DU/layer LP clearly sees the lower edge of the ozone hole SBUV doesn’t see the lower edge of the ozone hole Gradients are not as sharp as on the LP image Compare with NPP Limb Profiler

13
SBUV vs 4 mid-latitude sonde stations: 0 – 24 km layer (Lindenberg, Hoehnpeissenberg, Boulder, Payerne) We recommend using large layers for SBUV in lower stratosphere and upper troposphere
 We recommend using large layers for SBUV in lower stratosphere and upper troposphere")
14
Combined tropospheric layers agree with MLS: 254 – 16 hPa in tropics 254 – 25 hPa at mid and high latitudes 30° – 60° S 30° – 60° N 20° S – 20° N

16
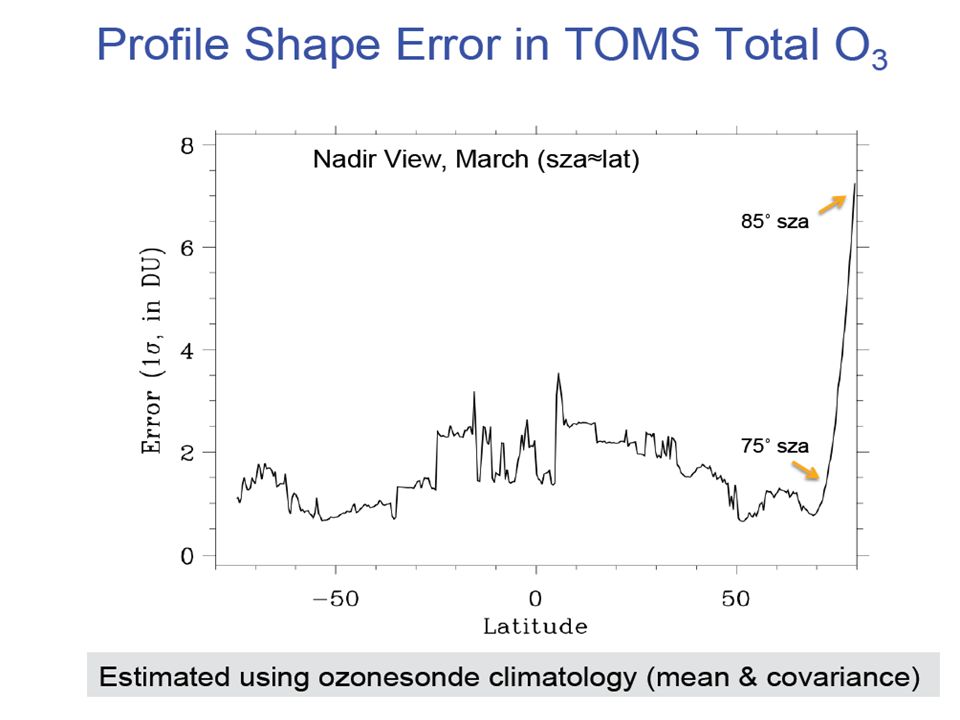
16 Conclusions ► SBUV agrees well with high resolution instruments in middle and upper stratosphere Above 20 km, we see little benefit from adding wavelengths or increasing measurement precision. ► Disagreement in lower stratosphere / troposphere is a result of low SBUV vertical resolution Averaging kernel brings agreement Additional wavelengths may give a bit more profile information in troposphere ► Total column ozone shape error significant SZA>80°

Similar presentations
. Significant quantitative differences.>")
 instrument on the Suomi NPP Satellite Pawan K. Bhartia Earth Sciences Division- Atmospheres NASA Goddard Space.>")


 Background -SBUV/2 instruments.>")


 nadir stare ozone profiles using ozonesonde measurements during Arctic Research on the Composition.>")
 nadir stare ozone profiles using ozonesonde measurements during Arctic Research on the Composition.>")


 study Richard S. Stolarski NASA GSFC In collaboration.>")


