Download presentation
Presentation is loading. Please wait.

1
+ Your Vote Is Your Voice Produced by the League of Women Voters® of Oregon Education Fund

2
+ Those who don’t vote allow others to make important decisions for them; low voter turnout may lead to a different election outcome than if voter turnout is high, and one vote can make a difference. (c) 2014 2
")
3
+ Oregon Voting In Oregon: – Every two years, there are Oregonians who are eligible to vote in an election, but choose not to vote. – In 2012, 1,095,940 eligible Oregonians did not vote in the general election. – Officially, 1,354,826 REGISTERED voters did NOT vote in the May 20, 2014 primary this year. – On a National level however, Oregon has one of the highest participation rates with 82.8%* voting compared to a national average of 57.5% in the 2012 presidential election. (c) 2014 3
")
4
+ How Does the Country Vote? Voting patterns seem to differ between general locations Many voters in cities tend to vote for different candidates than those in rural areas Industrial regions and farming regions will also see differing election results Let’s look at a map of general voting patterns between Democrats and Republicans across the country: (c) 2014 4
")
5
+ 2008: Red or Blue? 2008 Voter Pattern by County Obama (Democrat) Victory: Blue McCain (Republican) Victory: Red Which specific parts of the country appear to be mostly blue? Which parts mostly red?
 Victory: Blue McCain (Republican) Victory: Red Which specific parts of the country appear to be mostly blue. Which parts mostly red .")
6
+ 2008: Red or Blue? 2008 Voting Pattern by Population Obama (Democrat) Victory: Blue McCain (Republican) Victory: Red What happens to the map now that population is taken into account?
 Victory: Blue McCain (Republican) Victory: Red What happens to the map now that population is taken into account .")
7
(c) 2014 Voter Turn-Out in Presidential Elections What factors affect voter turn-out?
 2014 Voter Turn-Out in Presidential Elections What factors affect voter turn-out")
8
+ Voter Turn-Out: Election Type First and foremost, voters are more likely the come to the polls during Presidential Elections. Turn-out is significantly lower during mid-term election years, such as 2010 and 2014 Generally, voters are also more likely to vote in General Elections rather than Primaries. (c) 2014 8
")
9
+ Voter Turn-Out: Education Nationally, more voters vote in general elections than in primary elections. (c) 2014 9 In general, individuals with higher education credentials are more likely to turn out to the polls than those with less education.
 In general, individuals with higher education credentials are more likely to turn out to the polls than those with less education..")
10
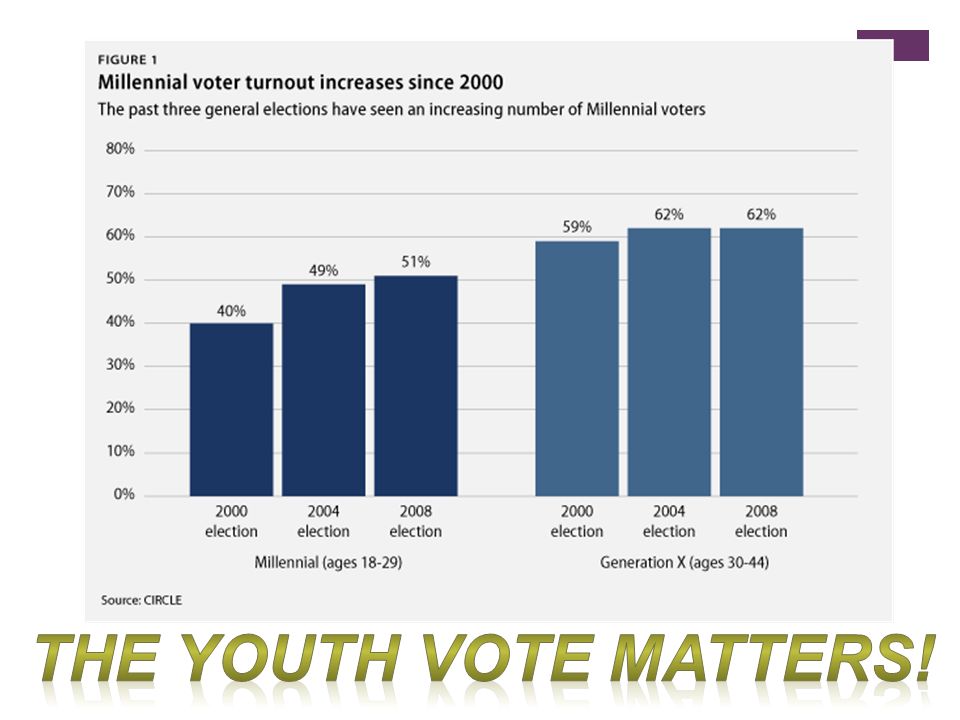
+ Voter Turn-Out: Age AGE MATTERS - Young people are consistently underrepresented in every election. (c) 2014 10 Voting and Registration by Age in US: 2012 General
 Voting and Registration by Age in US: 2012 General.")
12
+ Oregon’s 50% turnout requirement for tax measures In 1997 – Oregon voters approved a ballot measure requiring 50% voter participation to pass most revenue measures (referred to as the “double majority”). In 1998 – Oregon voters effectively repealed this requirement for Primary and General elections, but it still remains in effect for elections held at other times. (c) 2012 12
")
13
+ For more information, contact the League of Women Voters® of Oregon Education Fund www.VoteOregon.org/oregonmockelection mockelection@voteoregon.org; 503-581-5722 www.VoteOregon.org/oregonmockelection (c) 2014 13
")
Similar presentations


. Part 1: The Right to Vote & Qualifications How have voting rights changed over time? What restrictions exist on.>")


 Chapters 8 and 9.>")


