Download presentation
Presentation is loading. Please wait.

1
Chapter 8 Population Ecology

2
Chapter Overview Questions What are the major characteristics of populations? How do populations respond to changes in environmental conditions? How do species differ in their reproductive patterns?

3
Updates Online The latest references for topics covered in this section can be found at the book companion website. Log in to the book’s e-resources page at www.thomsonedu.com to access InfoTrac articles. InfoTrac: One Hatchling at a Time. Brownsville Herald (Brownsville, TX), July 2, 2006. InfoTrac: Where the Cattle Herds Roam, Ideally in Harmony With Their Neighbors. Jim Robbins. The New York Times, July 11, 2006 pF3(L). InfoTrac: A nudge for nature. Milwaukee Journal Sentinel, July 10, 2006. Earth Island Institute Environmental Defense: Creating a Conservation Community in Oregon’s Williamette Valley Marine Bio: Habitat Conservation
, July 2, InfoTrac: Where the Cattle Herds Roam, Ideally in Harmony With Their Neighbors. Jim Robbins. The New York Times, July 11, 2006 pF3(L). InfoTrac: A nudge for nature. Milwaukee Journal Sentinel, July 10, Earth Island Institute Environmental Defense: Creating a Conservation Community in Oregon’s Williamette Valley Marine Bio: Habitat Conservation.")
4
They were over- hunted to the brink of extinction by the early 1900’s and are now making a comeback. Core Case Study: Southern Sea Otters: Are They Back from the Brink of Extinction? Figure 8-1

5
Core Case Study: Southern Sea Otters: Are They Back from the Brink of Extinction? Sea otters are an important keystone species for sea urchins and other kelp- eating organisms. Figure 8-1

6
Video: Otter Feeding PLAY VIDEO

7
POPULATION DYNAMICS AND CARRYING CAPACITY Most populations live in clumps although other patterns occur based on resource distribution. Figure 8-2

8
Fig. 8-2a, p. 162 (a) Clumped (elephants)
 Clumped (elephants)")
9
Fig. 8-2b, p. 162 (b) Uniform (creosote bush)
 Uniform (creosote bush)")
10
Fig. 8-2c, p. 162 (c) Random (dandelions)
 Random (dandelions)")
11
Changes in Population Size: Entrances and Exits Populations increase through births and immigration Populations decrease through deaths and emigration

12
Age Structure: Young Populations Can Grow Fast How fast a population grows or declines depends on its age structure. Prereproductive age: not mature enough to reproduce. Prereproductive age: not mature enough to reproduce. Reproductive age: those capable of reproduction. Reproductive age: those capable of reproduction. Postreproductive age: those too old to reproduce. Postreproductive age: those too old to reproduce.

13
Limits on Population Growth: Biotic Potential vs. Environmental Resistance No population can increase its size indefinitely. The intrinsic rate of increase (r) is the rate at which a population would grow if it had unlimited resources. The intrinsic rate of increase (r) is the rate at which a population would grow if it had unlimited resources. Carrying capacity (K): the maximum population of a given species that a particular habitat can sustain indefinitely without degrading the habitat. Carrying capacity (K): the maximum population of a given species that a particular habitat can sustain indefinitely without degrading the habitat.
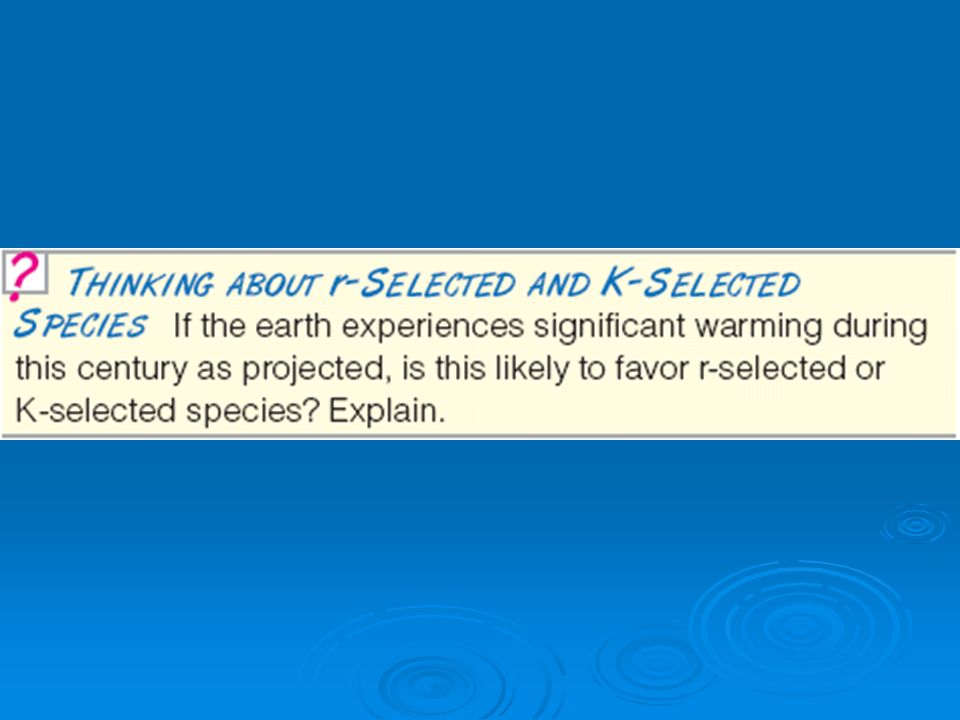
 is the rate at which a population would grow if it had unlimited resources. The intrinsic rate of increase (r) is the rate at which a population would grow if it had unlimited resources. Carrying capacity (K): the maximum population of a given species that a particular habitat can sustain indefinitely without degrading the habitat. Carrying capacity (K): the maximum population of a given species that a particular habitat can sustain indefinitely without degrading the habitat..")
14
Exponential and Logistic Population Growth: J-Curves and S-Curves Populations grow rapidly with ample resources, but as resources become limited, its growth rate slows and levels off. Figure 8-4

15
Fig. 8-3, p. 163 Environmental Resistance Time (t) Population size (N) Carrying capacity (K) Exponential Growth Biotic Potential
 Population size (N) Carrying capacity (K) Exponential Growth Biotic Potential.")
16
Animation: Exponential Growth PLAY ANIMATION

17
Video: Logistic Growth PLAY VIDEO

18
Exponential and Logistic Population Growth: J-Curves and S-Curves As a population levels off, it often fluctuates slightly above and below the carrying capacity. Figure 8-4

19
Fig. 8-4, p. 164 Carrying capacity Year Number of sheep (millions) Overshoot
 Overshoot")
20
Exceeding Carrying Capacity: Move, Switch Habits, or Decline in Size Members of populations which exceed their resources will die unless they adapt or move to an area with more resources. Figure 8-6

21
Fig. 8-6, p. 165 Number of reindeer Population overshoots carrying capacity Carrying capacity Year Population Crashes

22
Exceeding Carrying Capacity: Move, Switch Habits, or Decline in Size Over time species may increase their carrying capacity by developing adaptations. Some species maintain their carrying capacity by migrating to other areas. So far, technological, social, and other cultural changes have extended the earth’s carrying capacity for humans.

23
How Would You Vote? To conduct an instant in-class survey using a classroom response system, access “JoinIn Clicker Content” from the PowerLecture main menu for Living in the Environment. Can we continue to expand the earth's carrying capacity for humans? a. No. Unless humans voluntarily control their population and conserve resources, nature will do it for us. a. No. Unless humans voluntarily control their population and conserve resources, nature will do it for us. b. Yes. New technologies and strategies will allow us to further delay exceeding the earth's carrying capacity. b. Yes. New technologies and strategies will allow us to further delay exceeding the earth's carrying capacity.

24
Population Density and Population Change: Effects of Crowding Population density: the number of individuals in a population found in a particular area or volume. A population’s density can affect how rapidly it can grow or decline. A population’s density can affect how rapidly it can grow or decline. e.g. biotic factors like diseasee.g. biotic factors like disease Some population control factors are not affected by population density. Some population control factors are not affected by population density. e.g. abiotic factors like weathere.g. abiotic factors like weather

25
Types of Population Change Curves in Nature Population sizes may stay the same, increase, decrease, vary in regular cycles, or change erratically. Stable: fluctuates slightly above and below carrying capacity. Stable: fluctuates slightly above and below carrying capacity. Irruptive: populations explode and then crash to a more stable level. Irruptive: populations explode and then crash to a more stable level. Cyclic: populations fluctuate and regular cyclic or boom-and-bust cycles. Cyclic: populations fluctuate and regular cyclic or boom-and-bust cycles. Irregular: erratic changes possibly due to chaos or drastic change. Irregular: erratic changes possibly due to chaos or drastic change.

26
Types of Population Change Curves in Nature Population sizes often vary in regular cycles when the predator and prey populations are controlled by the scarcity of resources. Figure 8-7

27
Fig. 8-7, p. 166 Population size (thousands) Year Lynx Hare
 Year Lynx Hare")
28
Animation: Capture-Recapture Method PLAY ANIMATION

29
Case Study: Exploding White-Tailed Deer Populations in the United States Since the 1930s the white-tailed deer population has exploded in the United States. Nearly extinct prior to their protection in 1920’s. Nearly extinct prior to their protection in 1920’s. Today 25-30 million white-tailed deer in U.S. pose human interaction problems. Deer-vehicle collisions (1.5 million per year). Deer-vehicle collisions (1.5 million per year). Transmit disease (Lyme disease in deer ticks). Transmit disease (Lyme disease in deer ticks).
. Deer-vehicle collisions (1.5 million per year). Transmit disease (Lyme disease in deer ticks). Transmit disease (Lyme disease in deer ticks)..")
30
REPRODUCTIVE PATTERNS Some species reproduce without having sex (asexual). Offspring are exact genetic copies (clones). Offspring are exact genetic copies (clones). Others reproduce by having sex (sexual). Genetic material is mixture of two individuals. Genetic material is mixture of two individuals. Disadvantages: males do not give birth, increase chance of genetic errors and defects, courtship and mating rituals can be costly. Disadvantages: males do not give birth, increase chance of genetic errors and defects, courtship and mating rituals can be costly. Major advantages: genetic diversity, offspring protection. Major advantages: genetic diversity, offspring protection.
. Offspring are exact genetic copies (clones). Others reproduce by having sex (sexual). Genetic material is mixture of two individuals. Genetic material is mixture of two individuals. Disadvantages: males do not give birth, increase chance of genetic errors and defects, courtship and mating rituals can be costly. Disadvantages: males do not give birth, increase chance of genetic errors and defects, courtship and mating rituals can be costly. Major advantages: genetic diversity, offspring protection. Major advantages: genetic diversity, offspring protection..")
31
Sexual Reproduction: Courtship Courtship rituals consume time and energy, can transmit disease, and can inflict injury on males of some species as they compete for sexual partners. Figure 8-8

32
Reproductive Patterns: Opportunists and Competitors Large number of smaller offspring with little parental care (r- selected species). Fewer, larger offspring with higher invested parental care (K-selected species). Figure 8-9
. Figure 8-9.")
33
Fig. 8-9, p. 168 r species; experience r selection Time Number of individuals K Carrying capacity K species; experience K selection

34
Reproductive Patterns r-selected species tend to be opportunists while K-selected species tend to be competitors. Figure 8-10

35
Fig. 8-10a, p. 168 Many small offspring Little or no parental care and protection of offspring Early reproductive age Most offspring die before reaching reproductive age Small adults Adapted to unstable climate and environmental conditions High population growth rate (r) Population size fluctuates wildly above and below carrying capacity (K) Generalist niche Low ability to compete Early successional species r-Selected Species Cockroach Dandelion
 Population size fluctuates wildly above and below carrying capacity (K) Generalist niche Low ability to compete Early successional species r-Selected Species Cockroach Dandelion.")
36
Fig. 8-10b, p. 168 Fewer, larger offspring High parental care and protection of offspring Later reproductive age Most offspring survive to reproductive age Larger adults Adapted to stable climate and environmental conditions Lower population growth rate (r) Population size fairly stable and usually close to carrying capacity (K) Specialist niche High ability to compete Late successional species K-Selected Species SaguaroElephant
 Population size fairly stable and usually close to carrying capacity (K) Specialist niche High ability to compete Late successional species K-Selected Species SaguaroElephant.")
38
Survivorship Curves: Short to Long Lives The way to represent the age structure of a population is with a survivorship curve. Late loss population live to an old age. Late loss population live to an old age. Constant loss population die at all ages. Constant loss population die at all ages. Most members of early loss population, die at young ages. Most members of early loss population, die at young ages.

39
Survivorship Curves: Short to Long Lives The populations of different species vary in how long individual members typically live. Figure 8-11

40
Fig. 8-11, p. 169 Percentage surviving (log scale) Age Early loss Late loss Constant loss
 Age Early loss Late loss Constant loss")
41
Animation: Life History Patterns PLAY ANIMATION

42
Video: Coral Spawning PLAY VIDEO

43
Video: Kelp Forest (Channel Islands) PLAY VIDEO
 PLAY VIDEO")
44
Video: Salmons Swimming Upstream PLAY VIDEO

Similar presentations


 that live in the same place at the same time and compete for the same resources. Resources.>")


