Download presentation
Presentation is loading. Please wait.

1
WORKING WITH FINANCIAL STATEMENTS Chapter 3

2
Key Concepts and Skills Understand sources and uses of cash and the Statement of Cash Flows Know how to standardize financial statements for comparison purposes Know how to compute and interpret important financial ratios Be able to compute and interpret the Du Pont Identity Understand the problems and pitfalls in financial statement analysis

3
Chapter Outline Cash Flow and Financial Statements: A Closer Look Standardized Financial Statements Ratio Analysis The Du Pont Identity Using Financial Statement Information

4
Sample Balance Sheet

5
Sources and Uses Sources Cash inflow – occurs when we “ sell ” something Decrease in asset account (Sample B/S)Sample B/S Accounts receivable, inventory, and net fixed assets Increase in liability or equity account Accounts payable, other current liabilities, and common stock Uses Cash outflow – occurs when we “ buy ” something Increase in asset account Cash and other current assets Decrease in liability or equity account Notes payable and long-term debt
Sample B/S Accounts receivable, inventory, and net fixed assets Increase in liability or equity account Accounts payable, other current liabilities, and common stock Uses Cash outflow – occurs when we buy something Increase in asset account Cash and other current assets Decrease in liability or equity account Notes payable and long-term debt")
6
SOURCES AND USES OF CASH Sources of Cash :Activities that bring in cash. If an asset account went down, then on a net basis, the firm sold some assets. This would be a net source. Uses of cash : Activities that involve spending cash. A firm uses cash by either buying assets or making payments. An increase in an asset account means the firm bought some assets (a use of cash). If a liability account goes down, then the firm has made a net payment (a use of cash ).
. If a liability account goes down, then the firm has made a net payment (a use of cash )..")
7
SOURCES AND USES OF CASH Increase Asset (+A) Use of cash Decrease in liability or equity (-L /-E) Use of cash Decrease in an asset account (-A) Source of cash Increase in a liability OR Equity (+) Source of cash
 Use of cash Decrease in liability or equity (-L /-E) Use of cash Decrease in an asset account (-A) Source of cash Increase in a liability OR Equity (+) Source of cash")
8
We have calculated the change in each of the items on the balance sheets :

9
The net addition to cash = Sources - Uses

10
Income Statement

11
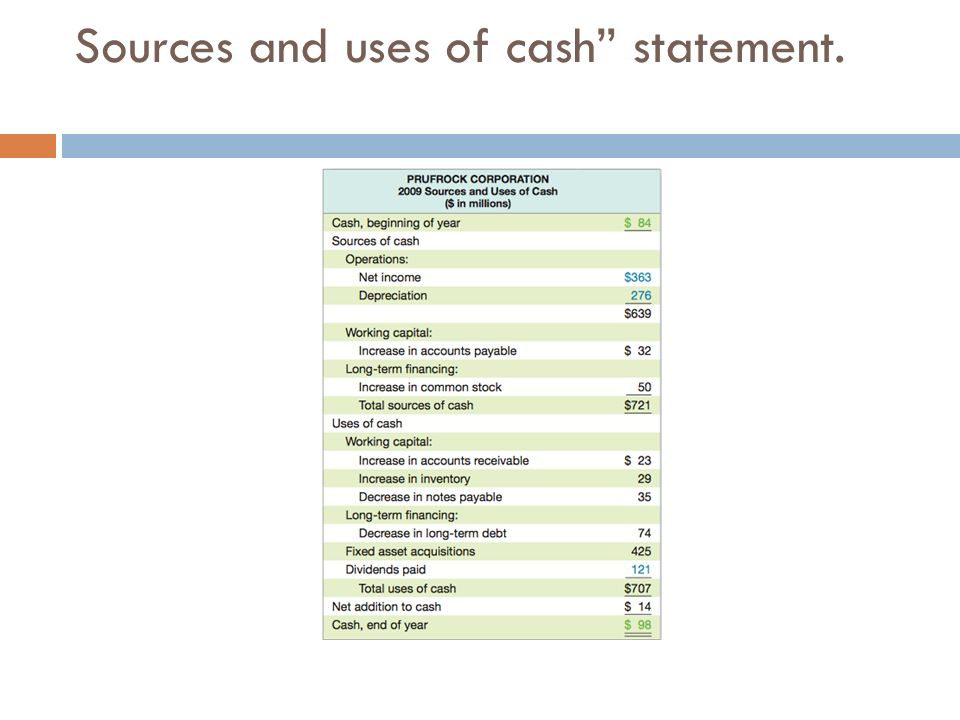
Statement of Cash Flows Statement that summarizes the sources and uses of cash Changes divided into three major categories Operating Activity – includes net income and changes in most current accounts Investment Activity – includes changes in fixed assets Financing Activity – includes changes in notes payable, long- term debt, and equity accounts, as well as dividends

12
Sources and uses of cash” statement.

14
Standardized Financial Statements Common-Size Balance Sheets Compute all accounts as a percent of total assets Common-Size Income Statements Compute all line items as a percent of sales Standardized statements make it easier to compare financial information, particularly as the company grows They are also useful for comparing companies of different sizes, particularly within the same industry

15
Common-Size Income Statements

16
Common-Size Balance Sheets

17
Common-Size Statements of Cash Flows It is also possible and useful to prepare a common- size statement of cash flows. Unfortunately, with the current statement of cash flows, there is no obvious denominator such as total assets or total sales. However, if the information is arranged in a way similar to that in Table 3.4, then each item can be expressed as a percentage of total sources (or total uses). The results can then be interpreted as the percentage of total sources of cash supplied or as the percentage of total uses of cash for a particular item.
. The results can then be interpreted as the percentage of total sources of cash supplied or as the percentage of total uses of cash for a particular item..")
18
COMMON–BASE YEAR FINANCIAL STATEMENTS: TREND ANALYSIS A standardized financial statement presenting all items relative to a certain base year amount. Imagine we were given balance sheets for the last 10 years for some company and we were trying to investigate trends in the firm’s pattern of operations. Does the firm use more or less debt? Has the firm grown more or less liquid?

19
COMMON–BASE YEAR FINANCIAL STATEMENTS: TREND ANALYSIS

20
or example, from 2008 to 2009, Prufrock’s inventory rose from $393 to $422. If we pick 2008 as our base year, then we would set inventory equal to 1.00 for that year. For the next year, we would calculate inventory relative to the base year as $422/393 1.07. In this case, we could say inventory grew by about 7 percent during the year. If we had multi- ple years, we would just divide the inventory figure for each one by $393. The resulting series is easy to plot, and it is then easy to compare companies. Table 3.7 summarizes these calculations for the asset side of the balance sheet.

21
COMBINED COMMON-SIZE AND BASE YEAR ANALYSIS The trend analysis we have been discussing can be combined with the common-size analysis discussed earlier. The reason for doing this is that as total assets grow, most of the other accounts must grow as well. By first forming the common-size statements, we eliminate the effect of this overall growth.

22
Example, looking at Table 3.7 We see that Prufrock’s accounts receivable were $165, or 4.9 percent of total assets, in 2008. In 2009, they had risen to $188, which was 5.2 percent of total assets. If we do our analysis in terms of dollars, then the 2009 figure would be $188/165 = 1.14, representing a 14 percent increase in receivables. However, if we work with the common-size statements, then the 2009 figure would be 5.2%/4.9% = 1.06. This tells us accounts receivable, as a percentage of total assets, grew by 6 percent. Roughly speaking, what we see is that of the 14 percent total increase, about 8 percent (=14% - 6%) is attributable simply to growth in total assets.
 is attributable simply to growth in total assets..")
23
Ratio Analysis Relationships determined from a firm’s financial information and used for comparison purposes. Ratios allow for better comparison through time or between companies As we look at each ratio, ask yourself what the ratio is trying to measure and why that information is important Ratios are used both internally and externally

24
Categories of Financial Ratios Short-term solvency or liquidity ratios Long-term solvency or financial leverage ratios Asset management or turnover ratios Profitability ratios Market value ratios

25
Liquidity Ratios The primary concern is the firm’s ability to pay its bills over the short run without undue stress. Consequently, these ratios focus on current assets and current liabilities. For obvious reasons, liquidity ratios are particularly interesting to short-term creditors.

26
Computing Liquidity Ratios Current Ratio = CA / CL 2,256 / 1,995 = 1.13 times Quick Ratio = (CA – Inventory) / CL (2,256 – 301) / 1,995 =.98 times Cash Ratio = Cash / CL 696 / 1,995 =.35 times NWC to Total Assets = NWC / TA (2,256 – 1,995) / 5,394 =.05 Interval Measure = CA / average daily operating costs 2,256 / ((2,006 + 1,740)/365) = 219.8 days
 / CL (2,256 – 301) / 1,995 =.98 times Cash Ratio = Cash / CL 696 / 1,995 =.35 times NWC to Total Assets = NWC / TA (2,256 – 1,995) / 5,394 =.05 Interval Measure = CA / average daily operating costs 2,256 / ((2, ,740)/365) = days")
27
Computing Long-term Solvency Ratios Total Debt Ratio = (TA – TE) / TA (5,394 – 2,556) / 5,394 = 52.61% Debt/Equity = TD / TE (5,394 – 2,556) / 2,556 = 1.11 times Equity Multiplier = TA / TE = 1 + D/E 1 + 1.11 = 2.11 Long-term debt ratio = LTD / (LTD + TE) 843 / (843 + 2,556) = 24.80%
 / TA (5,394 – 2,556) / 5,394 = 52.61% Debt/Equity = TD / TE (5,394 – 2,556) / 2,556 = 1.11 times Equity Multiplier = TA / TE = 1 + D/E = 2.11 Long-term debt ratio = LTD / (LTD + TE) 843 / ( ,556) = 24.80%")
28
Computing Coverage Ratios Times Interest Earned = EBIT / Interest 1,138 / 7 = 162.57 times Cash Coverage = (EBIT + Depreciation) / Interest (1,138 + 116) / 7 = 179.14 times
 / Interest (1, ) / 7 = times")
29
Computing Inventory Ratios Inventory Turnover = Cost of Goods Sold / Inventory 2,006 / 301 = 6.66 times Days ’ Sales in Inventory = 365 / Inventory Turnover 365 / 6.66 = 55 days

30
Computing Receivables Ratios Receivables Turnover = Sales / Accounts Receivable 5,000 / 956 = 5.23 times Days ’ Sales in Receivables = 365 / Receivables Turnover 365 / 5.23 = 70 days

31
Computing Total Asset Turnover Total Asset Turnover = Sales / Total Assets 5,000 / 5,394 =.93 It is not unusual for TAT < 1, especially if a firm has a large amount of fixed assets NWC Turnover = Sales / NWC 5,000 / (2,256 – 1,995) = 19.16 times Fixed Asset Turnover = Sales / NFA 5,000 / 3,138 = 1.59 times
 = times Fixed Asset Turnover = Sales / NFA 5,000 / 3,138 = 1.59 times")
32
Computing Profitability Measures Profit Margin = Net Income / Sales 689 / 5,000 = 13.78% Return on Assets (ROA) = Net Income / Total Assets 689 / 5,394 = 12.77% Return on Equity (ROE) = Net Income / Total Equity 689 / 2,556 = 26.96%
 = Net Income / Total Assets 689 / 5,394 = 12.77% Return on Equity (ROE) = Net Income / Total Equity 689 / 2,556 = 26.96%")
33
Computing Market Value Measures Market Price = $87.65 per share Shares outstanding = 190.9 million PE Ratio = Price per share / Earnings per share 87.65 / 3.61 = 24.28 times Market-to-book ratio = market value per share / book value per share 87.65 / (2,556 / 190.9) = 6.55 times
 = 6.55 times")
34
Deriving the Du Pont Identity ROE = NI / TE Multiply by 1 (TA/TA) and then rearrange ROE = (NI / TE) (TA / TA) ROE = (NI / TA) (TA / TE) = ROA * EM Multiply by 1 (Sales/Sales) again and then rearrange ROE = (NI / TA) (TA / TE) (Sales / Sales) ROE = (NI / Sales) (Sales / TA) (TA / TE) ROE = PM * TAT * EM
 and then rearrange ROE = (NI / TE) (TA / TA) ROE = (NI / TA) (TA / TE) = ROA * EM Multiply by 1 (Sales/Sales) again and then rearrange ROE = (NI / TA) (TA / TE) (Sales / Sales) ROE = (NI / Sales) (Sales / TA) (TA / TE) ROE = PM * TAT * EM")
35
Using the Du Pont Identity ROE = PM * TAT * EM Profit margin is a measure of the firm ’ s operating efficiency – how well it controls costs Total asset turnover is a measure of the firm ’ s asset use efficiency – how well does it manage its assets Equity multiplier is a measure of the firm ’ s financial leverage

36
Expanded Du Pont Analysis – Du Pont Data

37
Extended Du Pont Chart

38
Why Evaluate Financial Statements? Internal uses Performance evaluation – compensation and comparison between divisions Planning for the future – guide in estimating future cash flows External uses Creditors Suppliers Customers Stockholders

39
Benchmarking Ratios are not very helpful by themselves; they need to be compared to something Time-Trend Analysis Used to see how the firm ’ s performance is changing through time Internal and external uses Peer Group Analysis Compare to similar companies or within industries SIC and NAICS codes

40
Real World Example - I Ratios are figured using financial data from the 2007 Annual Report for Home Depot Compare the ratios to the industry as they are reported in Tables 3.11 and 3.12 in the book Home Depot ’ s fiscal year ends Feb. 3 Be sure to note how the ratios are computed in the table so you can compute comparable numbers Home Depot sales = $77,349 MM

41
Real World Example - II Liquidity ratios Current ratio = 1.15x; Industry = 1.7x Quick ratio =.23x; Industry =.4x Long-term solvency ratio Debt/Equity ratio (Debt / Worth) = 1.5x; Industry = 1.1x. Coverage ratio Times Interest Earned = 11.6x; Industry = 4.5x

42
Real World Example - III Asset management ratios: Inventory turnover = 4.4x; Industry = 3.8x Receivables turnover = 61.4x (6 days); Industry = 26.9x (14 days) Total asset turnover = 1.7x; Industry = 2.6x Profitability ratios Profit margin before taxes = 8.6%; Industry = 2.5% ROA (profit before taxes / total assets) = 14.9%; Industry = 6.4% ROE = (profit before taxes / tangible net worth) = 37.4%; Industry = 11.9%
; Industry = 26.9x (14 days) Total asset turnover = 1.7x; Industry = 2.6x Profitability ratios Profit margin before taxes = 8.6%; Industry = 2.5% ROA (profit before taxes / total assets) = 14.9%; Industry = 6.4% ROE = (profit before taxes / tangible net worth) = 37.4%; Industry = 11.9%")
43
Potential Problems There is no underlying theory, so there is no way to know which ratios are most relevant Benchmarking is difficult for diversified firms Globalization and international competition makes comparison more difficult because of differences in accounting regulations Varying accounting procedures, i.e. FIFO vs. LIFO Different fiscal years Extraordinary events

44
Quick Quiz What is the Statement of Cash Flows and how do you determine sources and uses of cash? How do you standardize balance sheets and income statements and why is standardization useful? What are the major categories of ratios and how do you compute specific ratios within each category? What are some of the problems associated with financial statement analysis?

45
Comprehensive Problem XYZ Corporation has the following financial information for the previous year: Sales: $8M, PM = 8%, CA = $2M, FA = $6M, NWC = $1M, LTD = $3M Compute the ROE using the DuPont Analysis.

Similar presentations